// the thesis question

Is Ether (ETH)
still worth holding?

It's the question every holder asks quietly. Almost nobody answers it from the only place the answer actually lives — the on-chain economy underneath Ethereum's digital asset.

Discover ETH's price drivers

// the honest case

Three concerns worth taking seriously.

If you've held ETH for the past two cycles, you have reasons to wonder. The price has gone sideways through a Bitcoin bull run, a wave of institutional capital arriving via spot ETFs, and a macro backdrop that should have been kind to risk assets. None of it has translated into the kind of move ETH used to deliver under conditions like these — and the question of why is the question that won't go away.

Three structural concerns show up in almost every honest holder conversation. They aren't internet bear-cope and they aren't maxi noise — they're the things sophisticated allocators actually raise when ETH comes up between people who know the asset. None of them is a knockout, individually. Together they're the reason the position feels heavier than it should.

The point of taking them seriously isn't to argue you out of holding or into it. It's to make sure whichever answer you arrive at is the one that survives the strongest version of each concern, not the weakest. So we'll sit with each in turn, in plain terms, before we look at what the data is actually doing today.

// worth surfacing

A holder weighing the post-Dencun L1 fee collapse against the structural case for ETH.

// the L1 side

concern noted

“Fees just collapsed.”

Daily L1 fees fell from roughly $35M at their March 2024 peak to about $566K within five months of Dencun shipping blob space. The largest fee line on the network lost 99% of its dollar value in less than half a year. If you read ETH as fees per token, the engine just got a lot smaller.

A holder considering ETH's loss of cultural narrative across the last two market cycles.

// the story side

concern noted

“The story’s gone quiet.”

Ethereum used to lead the conversation. For most of the last two cycles it hasn't — retail energy moved to Solana, the modular-vs-monolithic technical story moved everywhere else, and the loudest flows of 2024 were memecoins. A narrative drought doesn't move fundamentals. It does move multiples.

A holder asking whether institutional flows actually read the on-chain economy.

// the flow side

concern noted

“ETF flows ignore the data.”

Spot ETH ETFs have been live for over a year. Net flows are positive in aggregate but choppy, and they don't visibly track gas, fees, burn, or any on-chain measure. If the largest institutional bid in the market isn't reading the economy underneath, the fair question is whether anyone should.

Three concerns. All real. None of them disqualifying — but none of them answers what the asset is actually doing today either. To do that, you have to look at what the data itself is doing right now.

// what the data shows

The economy underneath, today.

Strip away the price chart, the discourse, and the ETF flows. What's left is Ethereum's on-chain economy — the gas paid by every smart-contract execution, every stablecoin transfer, every rollup batch that settles back to the base layer. That's the thing your ETH gives you a per-token piece of, and it's measurable by the block.

After 2024's Dencun upgrade moved rollup batches onto a separate blob market, the L1 gas everyone watches got smaller — and the per-token fee surface with it. The network underneath kept being used; the fee surface didn't keep pace. The question of where ETH stands today is what that picture — heavy usage, compressed on-chain economy — actually means for the asset.

Below is what that looks like as of July 5, 2026 — the underlying activity of the Ethereum network over the last six months, a few simple readings of what the network is doing right now, and where the per-token supply is moving.

// the four readings

Four simple measurements of what the Ethereum network is doing right now, alongside the scale of the economy already running on top of it.

// daily active addresses

492,000

July 5 · unique wallets, L1

// daily L1 transactions

2,760,000

July 5 · simple + contract calls

// the scale, in plain finance terms

$25 trillion

in stablecoin dollar volume moved across Ethereum, last 12 months.

For reference, that's more than Visa processed globally in the same year (~$15.8T) and more than the GDP of every country on Earth except the United States. Whatever you think of crypto narratively, the asset is already the rails for an economy at the scale of major financial infrastructure.

MAJOR KEY· Source: Ethereum Valuation Terminal

// net supply change

+83,800 ETH

last 30 days · issuance minus burn

// daily stablecoin volume

~$80 billion

typical day · USD, on Ethereum

Snapshot as of July 5, 2026 — the last fully populated day. Reference window: 6 months (180 days) for the chart. The four readings here are simplified summaries of what the network is doing on Ethereum L1; the scale anchor on the right is computed over the trailing twelve months.
Source: Ethereum Valuation Terminal.

That's the current shape of the data. What ETH structurally gives you in return — beyond a price line on a chart — is a separate question. That's the next layer.

// what you're actually holding

What you're actually holding.

ETH isn't a bet on price action. It's a per-token slice of every fee dollar that flows through the Ethereum network — the smart-contract executions, the stablecoin transfers, the MEV ordering, the rollup batches that settle on the base layer.

Hold it and what you actually own is two things. A piece of the network's economic activity, sized to the supply of ETH that exists to share it. And an exposure to whether that supply is shrinking or growing — the balance between issuance to validators and the burn from every transaction.

Both are measurable. Both are moving every block. Neither shows up on the spot price by itself.

Throughput exposure — a per-token piece of every fee dollar flowing through the Ethereum network.

// throughput exposure

A piece of the network itself.

Every gas dollar, every swap fee, every stablecoin transfer, every blob fee a rollup pays — they all route through the same network ETH is the commodity for. Hold one ETH and you own a tiny piece of all of that activity. The more the network does, the more that piece is exposed to.

Monetary stance exposure — each ETH gets rarer or doesn't, depending on which side of issuance and burn is winning.

// monetary exposure

Each ETH gets rarer, or doesn't.

Every transaction burns ETH and removes it from circulation. Validators add ETH back through issuance for securing the chain. The net of those two decides whether the supply of ETH is shrinking or growing, this month and over the cycle. When activity is high, the burn wins and each ETH gets rarer. When it's low, issuance wins and it doesn't.

Throughput exposure on one side. Monetary stance on the other. The asymmetric question — what those two combined exposures actually bet on — is the next layer.

// the asymmetric case

Either rollups scale, the L1 rebuilds, or both happen together.

The biggest open question across the concerns above and the data we just looked at is whether the L1 fee deflation is permanent or transitional. Asked rigorously, that's not a yes/no question — and it isn't strictly either-or. It's a fork, with both paths potentially live at the same time.

Path A: rollups scale. Activity migrates onto L2s, settles into Ethereum's blob market, and blob fees become the dominant fee surface on the network. The L1 stays lean and high-value. The per-token claim grows because the throughput grew, on a different layer.

Path B: rollups don't scale alone. The L2 ecosystem leaves room for activity that needs Ethereum's security to come back to L1, and the pre-Dencun fee market structurally rebuilds at higher base fees. The per-token claim grows because the L1 surface grew back — either alongside rollup scaling, or in its place.

A holder watching the blob market reprice as rollups scale on the Ethereum Valuation Terminal.
rollups scale

// path a

The blob market reprices.

Rollups bundle more activity, blob demand grows, and the blob market becomes the dominant fee surface on Ethereum. The L1 stays lean and high-value. The per-token claim grows through the new layer the protocol just built for exactly this future.

A holder watching the L1 fee market rebuild as activity returns to base layer on the Ethereum Valuation Terminal.
L1 rebuilds

// path b

The L1 market rebuilds.

Activity that needs Ethereum's security comes back to L1 — institutional settlement, high-value DeFi, anything that can't fully trust an L2 sequencer — and the pre-Dencun fee market structurally rebuilds at higher base fees. The per-token claim grows through the L1 layer reasserting itself, whether or not rollups continue scaling on top.

Both paths grow the per-token claim. So does the world where both happen at once — rollups continue to scale and the L1 fee market rebuilds alongside, each pulling a different kind of activity through Ethereum. The position structurally loses only if neither happens, if Ethereum stops being the settlement layer for this kind of activity altogether. That's the asymmetry.

// four common holders

Four kinds of ETH holders — one place to find your answer.

Each looks at ETH differently. The terminal works the same way for each of them — what changes is which part of the data lands hardest for you.

Open digital economySettlement layerMacro thesisCycles

// long-term conviction

You're already there.

Conviction holders are positioned for the structural thesis whether or not they articulate it that way. The terminal would show you the per-token claim has compounded through two protocol upgrades and a fee market overhaul. The position is intact — the explanation for why it's intact is what changes.

Price actionFundingLiquidationsOrderflow

// trader

You're trading the wrong layer.

Traders read external signals — price, funding, liquidations, orderflow. The terminal would show you those are the second derivative. The first is what the network is actually generating in fees per ETH this week. If you'd rather trade the signal than the positioning, you trade what's underneath.

NAVInflowsIssuer reportsCustodian

// ETF passive

You're holding without knowing what.

ETF passive exposure is wrapper-deep. The terminal would show you what's actually inside that wrapper — a per-token claim on a specific on-chain economy with measurable activity and a measurable supply dynamic. Knowing what you hold doesn't change the position. It changes how you size it.

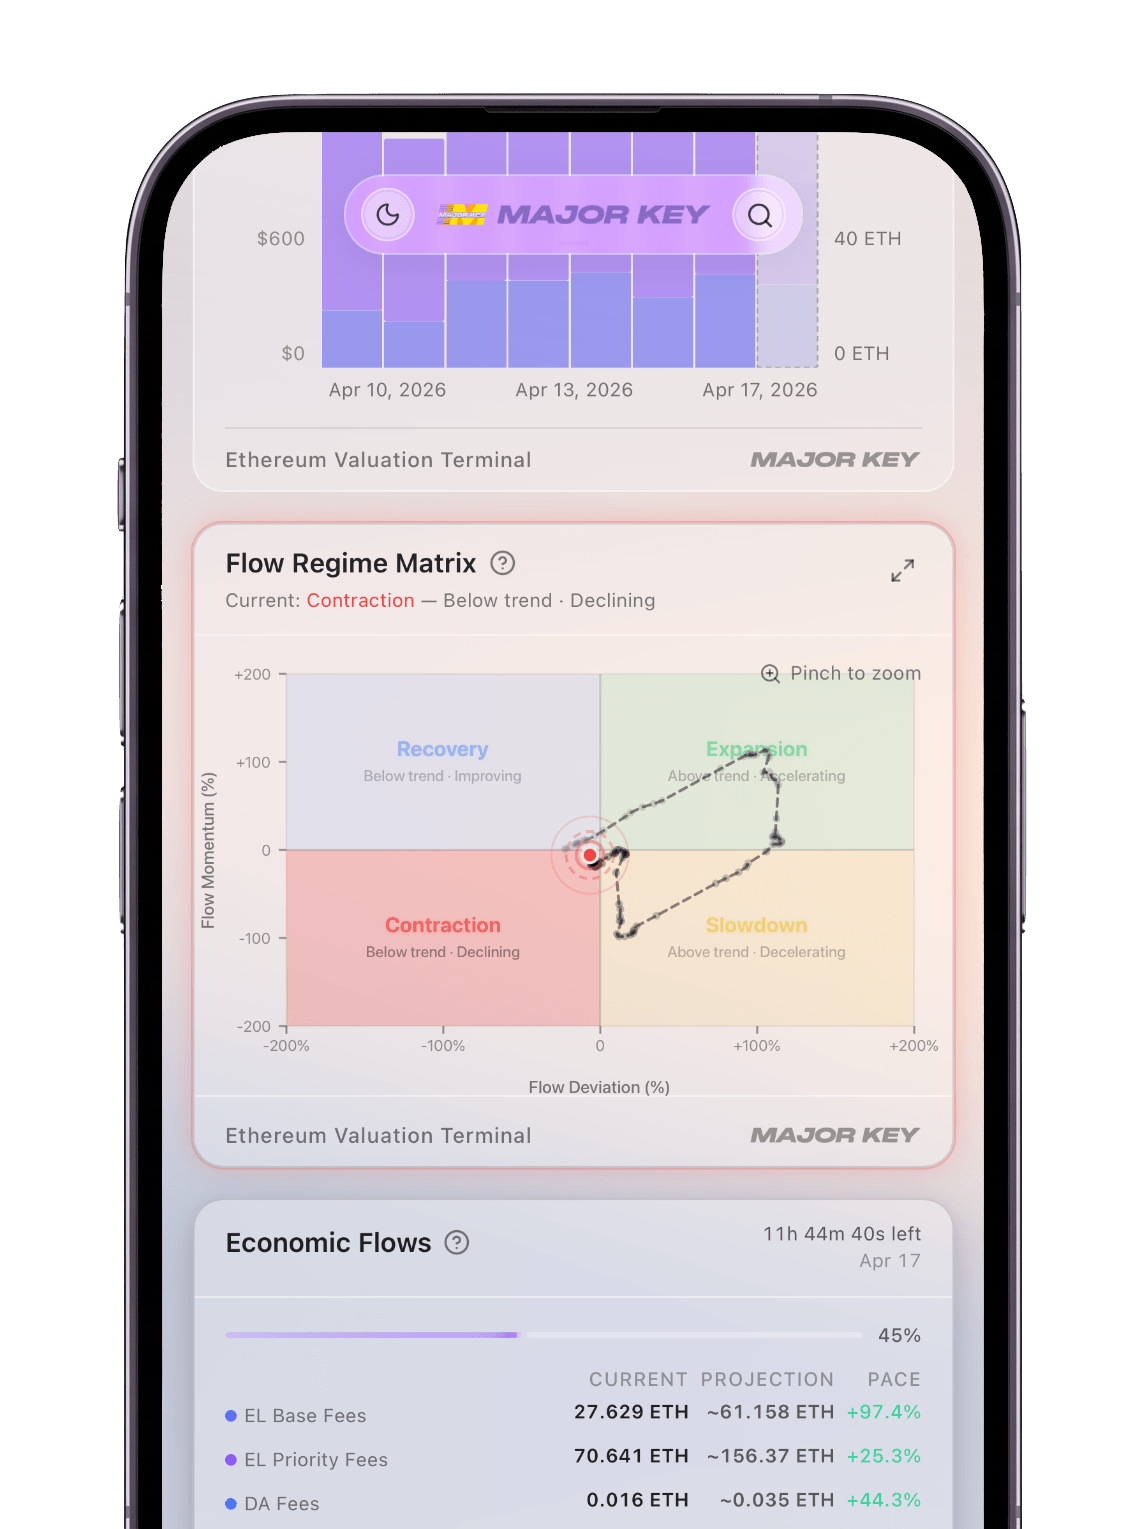
The Ethereum Valuation Terminal on mobile — the same data, surfaced for the holder asking the thesis question.

// the active asker

You're asking the right question.

Wherever you sit relative to the position right now — holding, sold, watching from the sidelines, considering entering — if you're seriously trying to answer the thesis question, you're the reader the terminal was built for. The structural picture, refreshed by the block, so the answer rests on what the network is actually doing rather than what the price chart suggests.

MAJOR KEYEthereum Valuation Terminal
Open

// before you decide

The questions worth asking.

The thesis, the timeframe, and the risk. If yours isn't covered here, the methods audit goes one layer deeper.

The thesis

The timeframe

The risk