The Method Comparison
Here's why every Ethereum valuation
gives you a different answer.
7 leading frameworks produce fair-value estimates from $820 to $740,000 — and there's a structural reason none of them converge.
Sources audited: CryptoQuant, VanEck, Coinbase Institutional, ARK Invest, CoinShares, Token Terminal, Etherealize, Consensys, ultrasound.money.Sources audited from CryptoQuant · VanEck · Coinbase Institutional · ARK Invest ·
CoinShares · Token Terminal · Etherealize · Consensys · ultrasound.money.
Already comparing frameworks? See how the tools that publish them compare too →
The state of consensus
The same $260 billion asset,
priced 900× apart by credible analysts.
These are not random takes. Each number below comes from a published model by a major research desk, asset manager, or on-chain data provider. The frameworks disagree by orders of magnitude.
P/Sales
$820
Severely overvalued
Token Terminal-style
NVT
$4,800
Slightly overvalued
CryptoQuant, 2024
Metcalfe's Law
$9,484
Deeply undervalued
CryptoQuant, 2024
DCF (revised)
$11,800
Cut 46% in 12mo
VanEck, Dec 2024
Sovereign Bond
$120,000
Long-term target
Coinbase Institutional
Etherealize
$740,000
Global macro target
Etherealize, 2025
Lowest
$820
P/Sales
Spread
~900×
low to high
Highest
$740,000
Etherealize
When credible models disagree by three orders of magnitude on the same balance sheet, the framework — not the data — is what's broken.
See it move
Watch every framework break.
We took the four most legible models — DCF, Ultrasound Money, Metcalfe, and NVT — and animated the exact moment each one stops describing Ethereum. Then the read that measures it in its own units, tested on data it had never seen.
Side-by-side
Every framework, audited —
— and where each one breaks.
We audited every major published Ethereum valuation model — DCF, Metcalfe, NVT, P/Sales, Cost-to-Corrupt, Sovereign Bond, and Ultrasound Money. For each one: what it actually measures, the single assumption it depends on, and the moment that assumption fails.
DCF / Staking Yield
$11,800 – $22,000
- What it measures
- Staking issuance + EIP-1559 burn, discounted at WACC.
- Biggest miss
- Staking yield has roughly halved since Dencun (Mar 2024) — from ~5.5% APR to under 3%. Both inputs compressed: L1 priority tips fell as throughput migrated to L2s. A DCF anchored on the pre-Dencun yield is mechanically wrong.
- Our verdict
- A real cash flow, modeled with the wrong tool. Equity DCF assumes stable distribution. Ethereum changes its monetary policy by hard fork.
Ultrasound Money
Qualitative — "deflationary therefore valuable"
- What it measures
- Net issuance after burn. Compares ETH supply curve to BTC.
- Biggest miss
- After Dencun (Mar 2024), L1 base-fee burn collapsed and the EIP-4844 blob base fee sits near its 1-wei floor — together the two burn streams no longer offset validator issuance. ETH supply has been net inflationary on a year-over-year basis ever since.
- Our verdict
- Half a thesis. Sound money is a property, not a valuation. It tells you a token is hard to debase — not what it should cost.
Metcalfe
$2,400 – $9,484
- What it measures
- Active addresses squared (or n·log(n)). Network size as proxy for value.
- Biggest miss
- Metcalfe's Law was derived for telecom networks: one address = one user, connecting bilaterally to other users. Ethereum violates both premises — one user holds many addresses (smart wallets, multisigs, throwaways), and most activity is user-to-contract, not user-to-user. The n² scaling has no foundation here.
- Our verdict
- A heuristic for telecoms applied to a programmable economy. The fit is correlational, not causal.
NVT
$3,200 – $4,800
- What it measures
- Market cap ÷ transaction volume. The crypto P/E ratio.
- Biggest miss
- NVT was built for Bitcoin, where transaction volume approximates value transferred in the native asset. On Ethereum, the bulk of measured volume is stablecoin transfers, MEV-driven arbitrage, and DeFi internal flows — none of which represents value accruing to ETH the asset. The ratio measures activity intensity, not ETH's claim on it.
- Our verdict
- A volume ratio dressed as valuation. Useful for sentiment timing, not for fair value.
P/Sales
$677 – $820
- What it measures
- Market cap ÷ annualized fees. Borrowed directly from SaaS valuation.
- Biggest miss
- Ethereum has no firm, no shareholders, and no sales line — it's a public protocol, not a business. P/Sales applies an equity multiple to L1 fees, but ETH holders have no equity-style claim on those fees: validators take the priority tips, the base fee burns. The framework is applying corporate-finance machinery to something that isn't a corporation.
- Our verdict
- Right to look at fees. Wrong to ignore where they migrated. A SaaS lens on a settlement asset.
Cost-to-Corrupt
Floor only — "ETH must exceed cost to attack"
- What it measures
- Total ETH staked × replacement cost of validator security.
- Biggest miss
- Defines a price floor, not a price. Cost-to-attack tells you the security budget. Markets price expected value, not infrastructure cost.
- Our verdict
- The strongest qualitative frame in this list. But "you can't attack it for less than X" isn't a fair value — it's a moat.
Sovereign Bond
$50,000 – $740,000
- What it measures
- ETH treated as a perpetuity on global settlement. Coupon = burn + staking yield.
- Biggest miss
- Two unfalsifiable assumptions: (1) ETH captures a fixed share of global GDP, (2) the discount rate is sovereign-bond-low. Move either assumption 1% and the target moves 50%.
- Our verdict
- Aspiration dressed as DCF. The most-cited numbers in crypto are also the most assumption-sensitive.
Every output range and revision below is sourced. Drill down on each method ↓
Method by method
Every method, in plain English.
Click any framework below to see what it actually models, the most recent published number, and the structural reason it's been revised — or quietly abandoned.
The pattern
It's the frame — not the data.
Look at what each framework was actually designed for. Every one of them was built decades before Ethereum existed — to solve a problem that isn't Ethereum's.
- Discounted Cash Flow1962Industrial firms with predictable dividends
- Metcalfe's Law1980Telephone networks measured by subscribers
- P/Sales multiples1990sPublic SaaS companies with subscription revenue
- MV = PQ1911Sovereign currencies in stable monetary regimes
- NVT (Network Value to Transactions)2017Bitcoin's pre-rollup transaction throughput
- Cost-to-Corrupt2014Proof-of-Work security budgets
- Sovereign perpetuity bond17th c.Government debt with fixed coupons
Every framework above was designed for an asset that doesn't exist on Ethereum: a firm that pays dividends, a network with stable users, a SaaS company with subscription fees, a chain with no rollups, a consensus mechanism that's now obsolete.
Apply the wrong lens and you get the wrong answer. That's not analyst error — it's category error. New asset class, borrowed toolkit. None of these models were built to value a programmable settlement layer with native economic flows. They were never going to converge, because they aren't looking at the same thing.
Ethereum has its own native economic flows. Its own rate of capital deployment. Its own monetary signal. The right model isn't a cleaner DCF — it's the one that reads Ethereum on its own terms.
Our approach
We built the model
that
reads Ethereum natively.
Flow Intensity measures the rate at which capital is actually being deployed on-chain — denominated in ETH, not borrowed from the equity playbook. Flow Deviation tells you when price has detached from those flows. Together they produce one thing the seven frameworks above cannot: a real-time, falsifiable fair value.
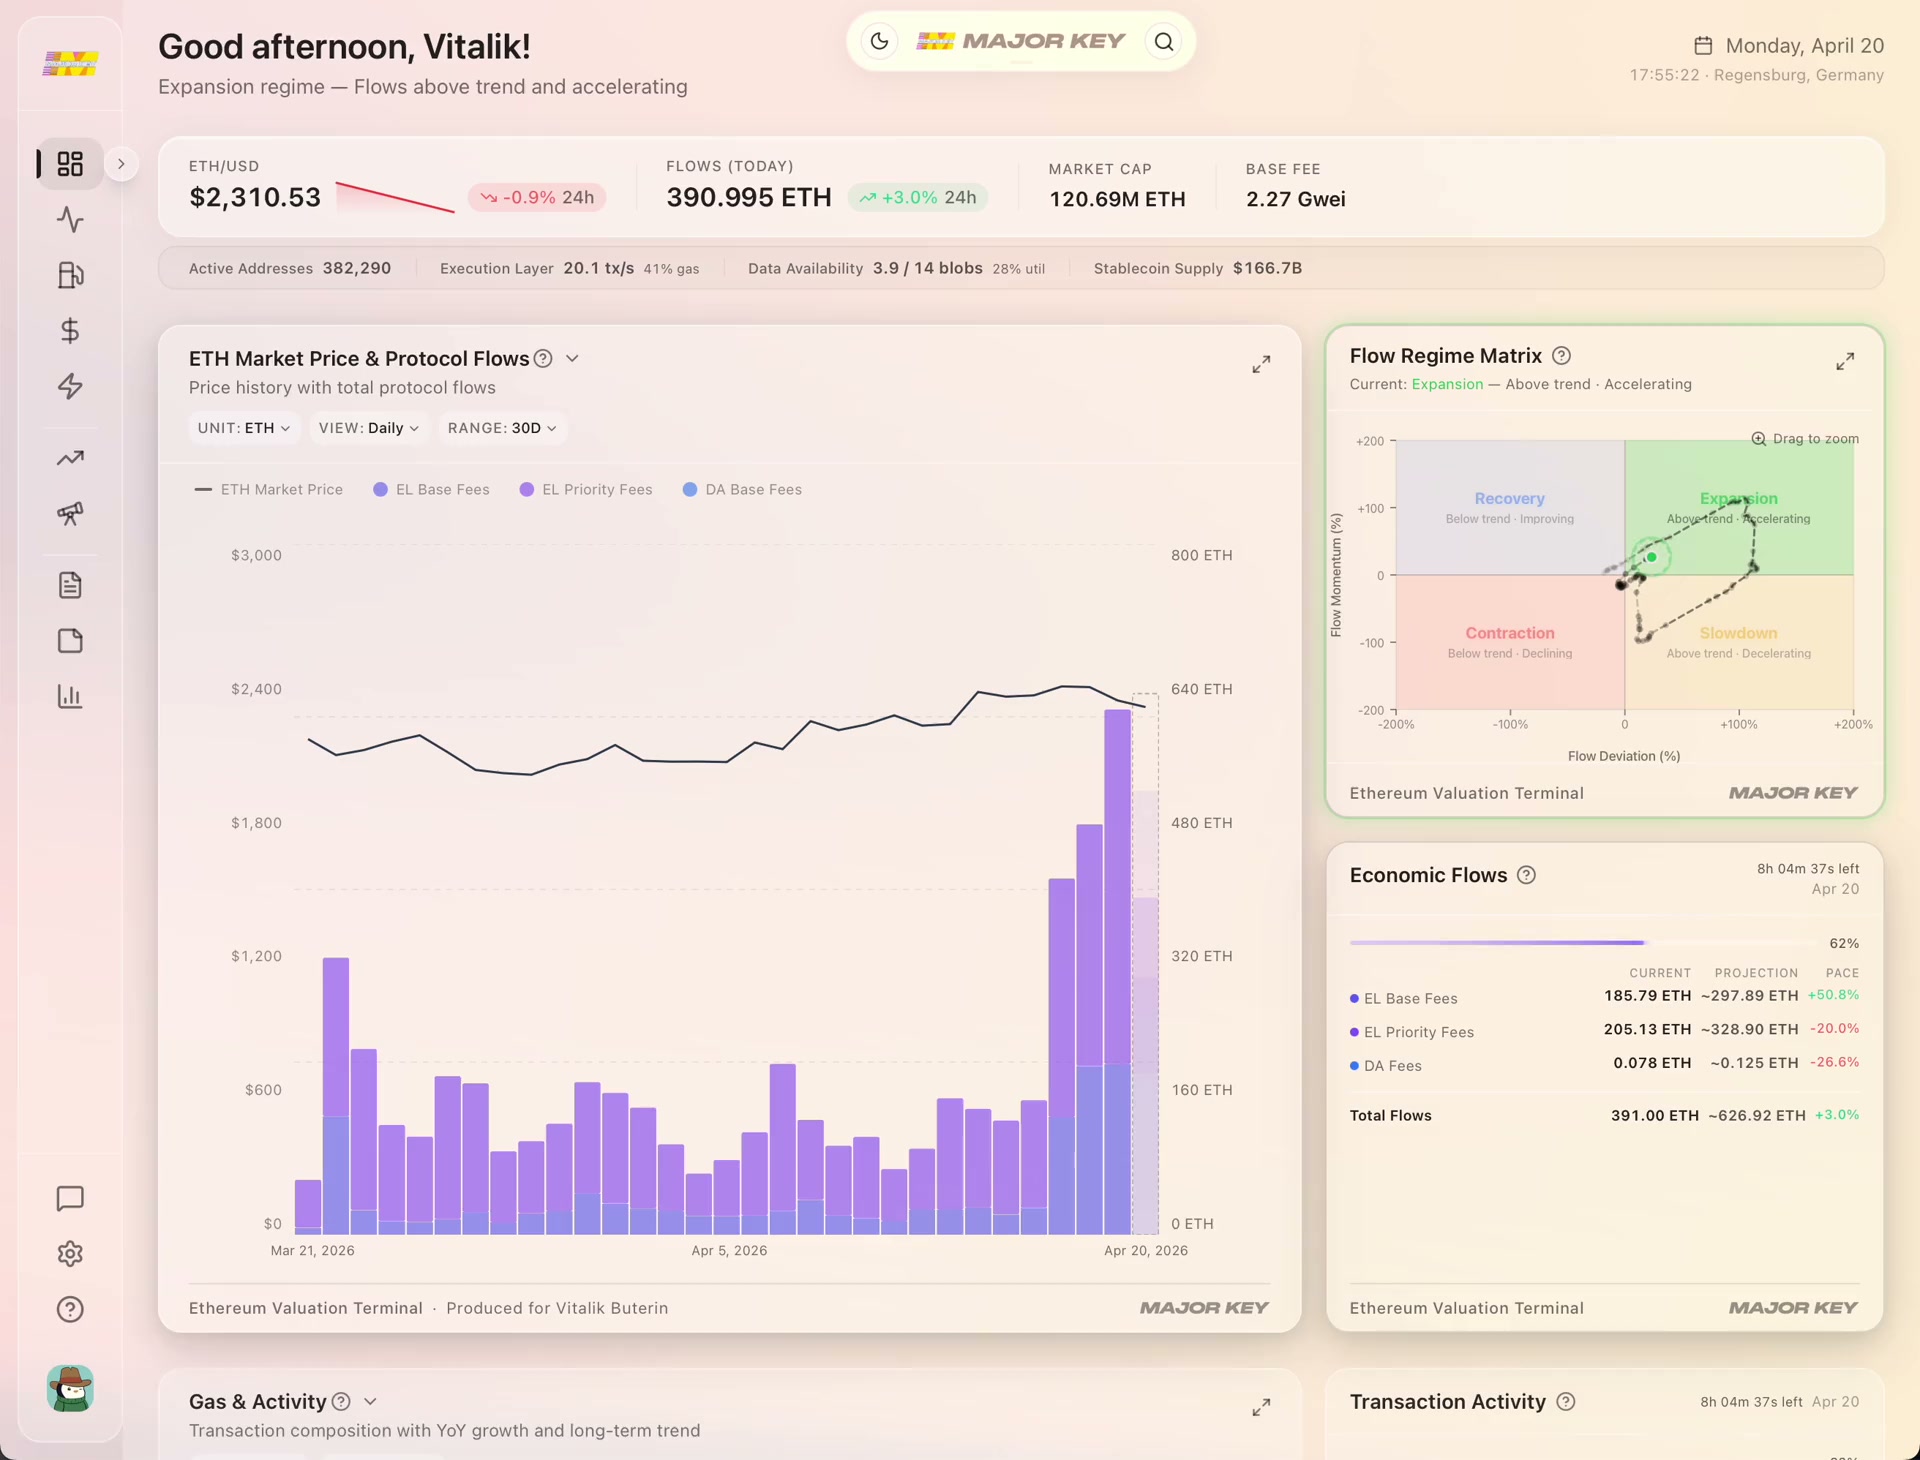
The Ethereum Valuation Terminal — Flow Intensity, Flow Deviation, and implied fair value, updated daily.
76.4%
Out-of-sample directional accuracy
Naive benchmark: 35.5% · +41 pp lift
22.8%
Peak in-sample R²
At the 45-day return horizon
Management Science
Working paper, under review
Dünnes & Felsenstein-Eckberg
Common questions
The questions we get most.
If you're comparing this to the seven frameworks above, these are the questions worth asking — and our honest answers.
Sources audited
VanEck
2024
VanEck
ETH Long-Term Outlook
2024
CoinShares
2024
CoinShares
ETH Valuation Update
2024
Coinbase Institutional
2025
Coinbase Institutional
ETH as a Sovereign Bond
2025
ARK Invest
2025
ARK Invest
Big Ideas — Crypto chapter
2025
CryptoQuant
2024
CryptoQuant
12-Model Valuation Survey
2024
Token Terminal
Live
Token Terminal
P/S Multiples
Live
Etherealize
2025
Etherealize
ETH at $740,000
2025
Consensys
2025
Consensys
Industrialization of Trust
2025
ultrasound.money
Live
ultrasound.money
Supply dashboard
Live
Burniske & Tatar
2017
Burniske & Tatar
Cryptoassets
2017
Pfeffer
2017
Pfeffer
An (Institutional) Investor's Take
2017
Wheatley et al.
2018
Wheatley et al.
Are Bitcoin Bubbles Predictable?
2018
All output ranges, revisions, and quoted figures are drawn from publicly available research as of November 2025. Where multiple revisions exist, we use the most recent published number from the original research desk.