

// equity frame
doesn't fit“It’s a company.”
Priced on earnings and multiples — except ETH has no income statement, no buyback yield, no quarterly call. Discount rates don't apply to cash flows that don't exist in that form.
// the part underneath
Most of what you read about ETH tells you who's buying. But underneath sits an entire economy that tells you why — and almost nobody is reading it.
// before you can price it
Most analysts reach for the nearest familiar asset — a company, a bond, a copy of gold. None of those frames actually fit ETH, which is why fair-value estimates across sixteen serious desks can land fourteen times apart. That kind of dispersion isn't a modelling problem; it's a categorisation problem. Two desks that disagree on what ETH structurally is will arrive at incompatible numbers no matter how careful their inputs are.
Three reflexes show up over and over in valuation conversations about ETH. Each borrows from a familiar asset class — equity, fixed-income, store-of-value — and each quietly omits the part of Ethereum that doesn't actually fit. The omissions aren't oversights; they're load-bearing. The frame only feels coherent because the awkward part of ETH has been cropped out of it.
Once you say them out loud, the cracks are obvious. None of these three frames survives a careful look at what the asset actually is. They persist anyway, because the standard desk vocabulary doesn't yet have language for an asset that's part-commodity, part-network, and part-monetary instrument — so the closest familiar shape gets reached for by default.
// the wrong boxes
// equity frame
doesn't fitPriced on earnings and multiples — except ETH has no income statement, no buyback yield, no quarterly call. Discount rates don't apply to cash flows that don't exist in that form.

// bond frame
doesn't fitStaking yield looks like a coupon — until you remember the principal is denominated in the same volatile asset that pays it. ETH staked at 3.5% in dollar terms can be down 30% by the time the coupon arrives. The bond frame quietly omits the principal.

// scarcity frame
doesn't fitBitcoin's scarcity story pulled this lens across the whole asset class. But ETH issues against its own activity, the supply is dynamic, and the demand comes from an economy running on top. Hard-cap reasoning doesn't survive contact with either side.
Three frames. Three different ETH prices. All anchored to the wrong reference asset. Before we can answer what drives the price, we have to pick the right category.
// the right category
Strip away the inherited analogies and the structure underneath is simpler than it looks — a network of computation, and a commodity that pays for every transaction that runs on it.
The chain is the infrastructure. The applications are the businesses operating on top. ETH is the commodity that pays for every block of activity inside that economy — the fuel, the unit of account, and the asset holders are exposed to.
It isn't a stock; there are no earnings to discount. It isn't a bond; there's no fixed coupon. It isn't gold; the supply moves with usage. What it is, structurally, is the commodity that powers a digital economy — and what holders are exposed to is the size and shape of the flow that runs through that economy.

// the network
Thousands of applications — exchanges, lending venues, stablecoin issuers, tokenisation platforms — running on a common settlement layer that none of them controls. The infrastructure, not any single business on top, is what we're classifying.

// the commodity
Every transaction inside the network is denominated in, and settled with, ETH. Gas, fees, validator rewards, the burn — all paid in the same commodity. Owning ETH is exposure to the size and shape of that flow.
// the frame
Once ETH is the network's commodity, the question shifts — from who's buying the asset, to what's flowing through the network it powers. Every metric you've seen about ETH belongs to one of these two categories.

Who's buying and how they're positioned.
Capital allocation behavior — investors, funds, ETFs, and large wallets moving ETH between addresses, custodians, and exchanges. Most of crypto's analytics infrastructure points here.
// tracked everywhere
Six serious dashboards, all answering the same question — who's positioned how. None of them surface what the network underneath is actually doing block by block.

What's happening inside the economy.
On-chain economic activity — gas paid to execute transactions, fees paid to execute smart contracts, blob fees from L2 rollups, validator rewards, the burn. The activity Ethereum's economy facilitates, every block.
// where the terminal lives// where the Ethereum Valuation Terminal lives
No major dashboard combines these into a single per-token measure of what the economy is actually doing. The Ethereum Valuation Terminal was built around exactly this gap — L1 fees, blob fees, issuance, and the burn, synthesised into one read of the network underneath.
External flows describe the asset. Internal flows describe the economy. The first tells you who is currently exposed to ETH. The second tells you whether the network underneath is doing more or less than it was — and that is where price ultimately comes from.
// inside the internal flows
The fees flowing through Ethereum aren't monolithic. A handful of categories produce most of the smart-contract activity, and their relative weights move predictably with the cycle and with each protocol upgrade.
The baseline is gas. Every transaction on Ethereum pays it, denominated in ETH — even moving funds between two addresses pays a fee that flows through the network.
The more interesting layer is what runs on top. Smart contracts execute the actual business logic of the economy — exchanges routing trades, lending protocols managing collateral, stablecoin issuers minting and burning, MEV searchers and builders ordering the blocks themselves. Each one is, increasingly, a digital business, and the fee each generates flows back through the same network ETH is the commodity for.
// where the smart-contract gas comes from
Each tile's share is the slice of identified smart-contract gas demand on Ethereum L1 consumed by that category over the trailing 90 days. Shares are normalised to 100% of categorised activity. The ETH figure underneath each bar is the absolute gas paid into that category over the same window.
Flashbots, Beaverbuild, Titan, Rsync
~4,583 ETH · trailing 90 days
Trading, NFTs, bridges, wallets
~2,698 ETH · trailing 90 days
// annualised fee flow
$271,838,518
Total fees paid into Ethereum (L1 execution + blob) over the trailing twelve months, as of July 5, 2026. These are the protocol's annualised fee flows — what the network actually captures from the economic activity running on top of it — not the asset's market cap.
 · Source: Ethereum Valuation Terminal
USDC, USDT, DAI
~2,228 ETH · trailing 90 days
Uniswap, Aave, Curve, Morpho
~1,570 ETH · trailing 90 days
Static snapshot, trailing 90 days as of July 5, 2026. “Identified” excludes the unclassified smart-contract bucket and simple ETH transfers between externally-owned accounts, which together still account for roughly half of total L1 gas. Shares move with the cycle and with each protocol upgrade — the categories themselves don't.
Source: Ethereum Valuation Terminal.
// where the fees went
The execution layer still produces almost all of the fee dollars on Ethereum. But the activity that used to congest it — the rollups bundling transactions on top — now flows through a dedicated, much cheaper data layer, leaving the L1 gas market a fraction of what it was at peak.
In early 2024, the Ethereum protocol introduced a dedicated, much cheaper data lane — blob space — purpose-built for the rollups that scale Ethereum. Before, those rollups posted their batched transactions directly into L1 calldata, paying full L1 gas prices to do so. That demand kept the L1 gas market congested and elevated, with daily L1 fees regularly clearing $35 million.
With blob space available, rollup batching moved off calldata almost entirely. The L1 gas market deflated quickly. Per-transaction fees on L1 fell to a small fraction of their previous level, and daily L1 fees now sit closer to $566K.
The activity itself didn't disappear — it relocated. Rollups pay Ethereum for data availability instead of execution, and that becomes a separate fee layer of its own. The fee dollars still flow through Ethereum. They just flow through a different surface.
Whether the trade is a long-term net positive depends on a single question. Does the activity on the new, cheaper layer scale fast enough to compensate for the loss of the congestion fees on the old one? That question is one of the most important open structural debates in Ethereum.
// four common readings
Each lens gives a different answer. None is wrong in the abstract — but only one is built around what Ethereum's economy is actually doing.
Positioning-driven. Reacts quickly to ETF flows, exchange netflows, and whale dashboards. Strongest at “what’s likely to move price this week?” Weakest at seeing structural shifts before they’re already in the chart.
Sentiment-driven. Built around the prevailing story. Strongest at riding cycles while the narrative holds. Weakest when the narrative changes and the data already has.
Where most research desks live. Combines flows and stories into a quarterly thesis. Strongest at producing publishable views. Weakest at speed — by the time the quarterly ships, the structural shift has often already happened.
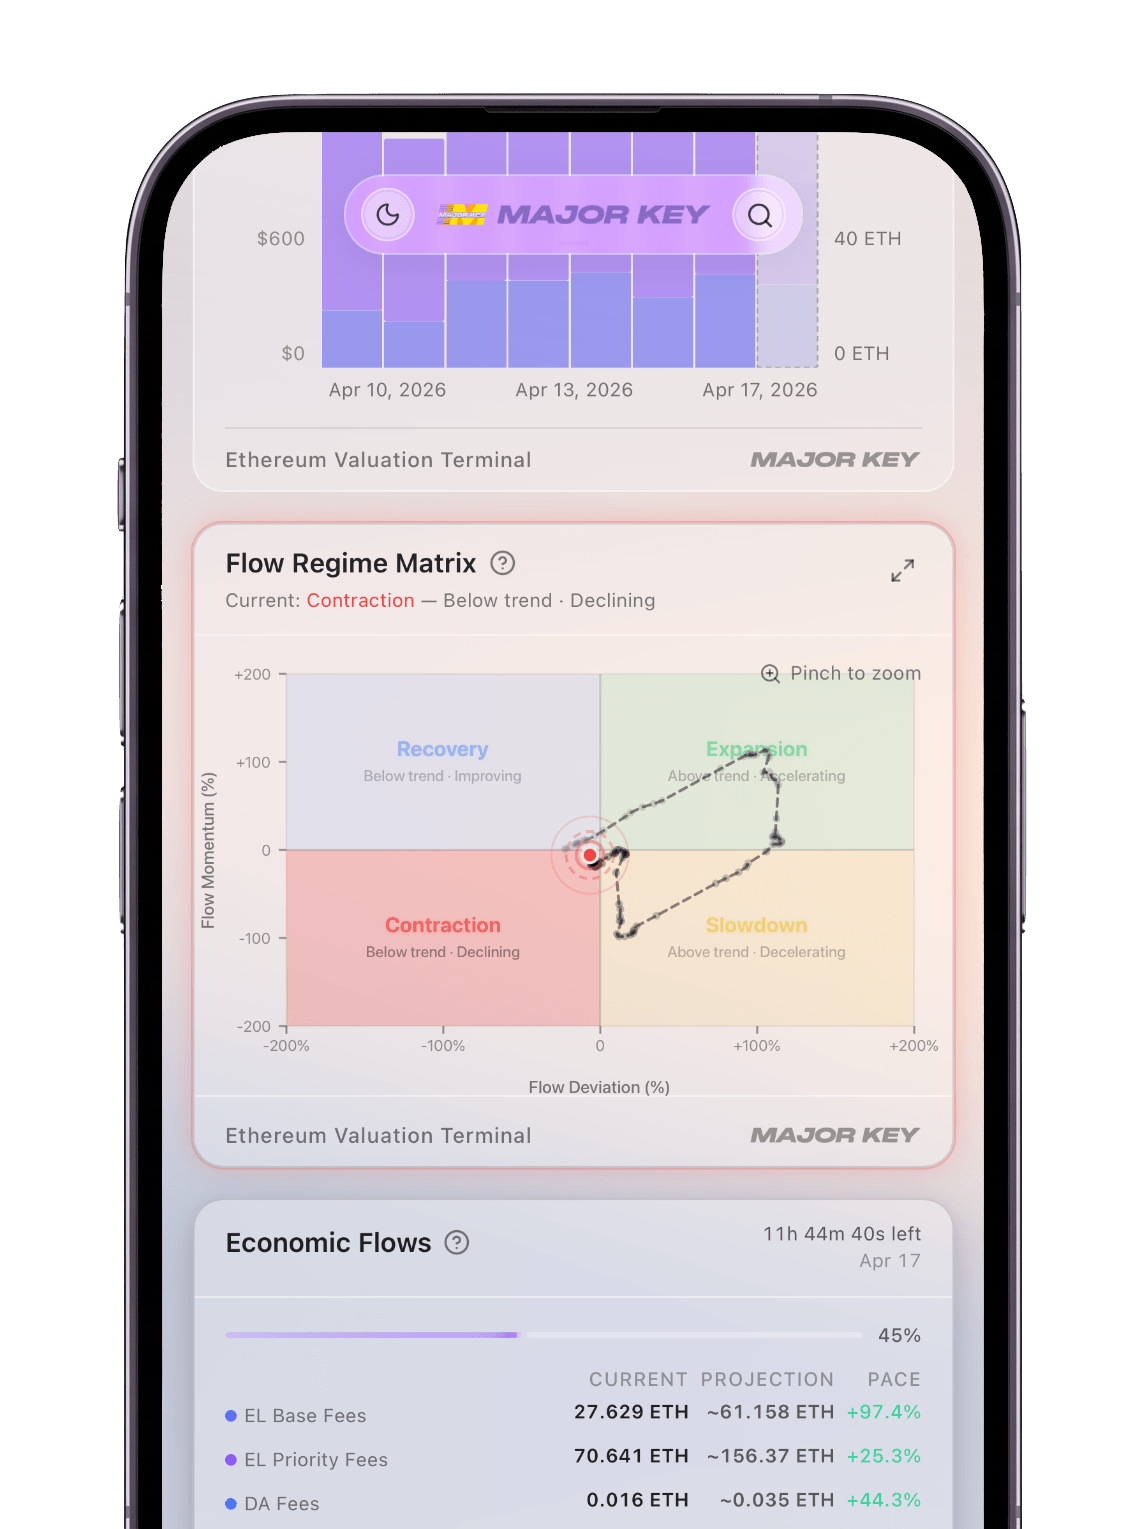
Fundamentals-driven. Starts with what Ethereum's economy is doing, block by block, and reads everything else against that anchor. Slow to react to noise. Fast to recognise real shifts in the underlying flows.
Ethereum Valuation Terminal// keep reading

Companion piece
With all of this in mind — the thesis question, asked honestly. Three real concerns, what the lens says today, and the structural shape of holding ETH from here.
Read the companion piece
Continue
People have tried to value Ethereum for years. Most got it wrong — and where each method breaks is its own structural story.
Read the methods audit
// before you go deeper
The framework, the mechanics, and what they imply for the price. If yours isn't covered here, the methods audit goes one layer deeper.
The framework
The mechanics
What it means


