Qualitative research
Premium research firms package thesis, governance, and ecosystem narrative for ETH allocators — long-form analyst opinion, weekly market notes, and analyst calls. The qualitative layer most desks already pay for.
The Tool Comparison
12 premium tools cover Ethereum from every angle except one — a science-backed, real-time fair value. The terminal publishes that number, every block. Read below how the terminal compares — and even beats them.
See why every model gives a different answer// The actual gap
Three layers your stack already covers — research, on-chain, fundamentals. Combined, they tell you what ETH was, what's flowing, and what other chains look like. None of them tell you what ETH is worth right now.
Premium research firms package thesis, governance, and ecosystem narrative for ETH allocators — long-form analyst opinion, weekly market notes, and analyst calls. The qualitative layer most desks already pay for.
Analytics terminals turn live blockchain telemetry into wallet flows, exchange data, and on-chain ratios. The descriptive read on what’s moving across the major venues, refreshed continuously and labelled wallet-by-wallet.
Fundamentals aggregators standardise TVL, fees, revenue, and cross-chain comparables across chains and protocols. The metrics layer that lets you rank ecosystems and applications side-by-side on a common scale.

The synthesis layer your stack is missing. Science-backed, ETH-native, refreshed every block — the three layers above turned into one defensible number for ETH, on a screen designed for the moments before you commit.

A live fair value, in hand
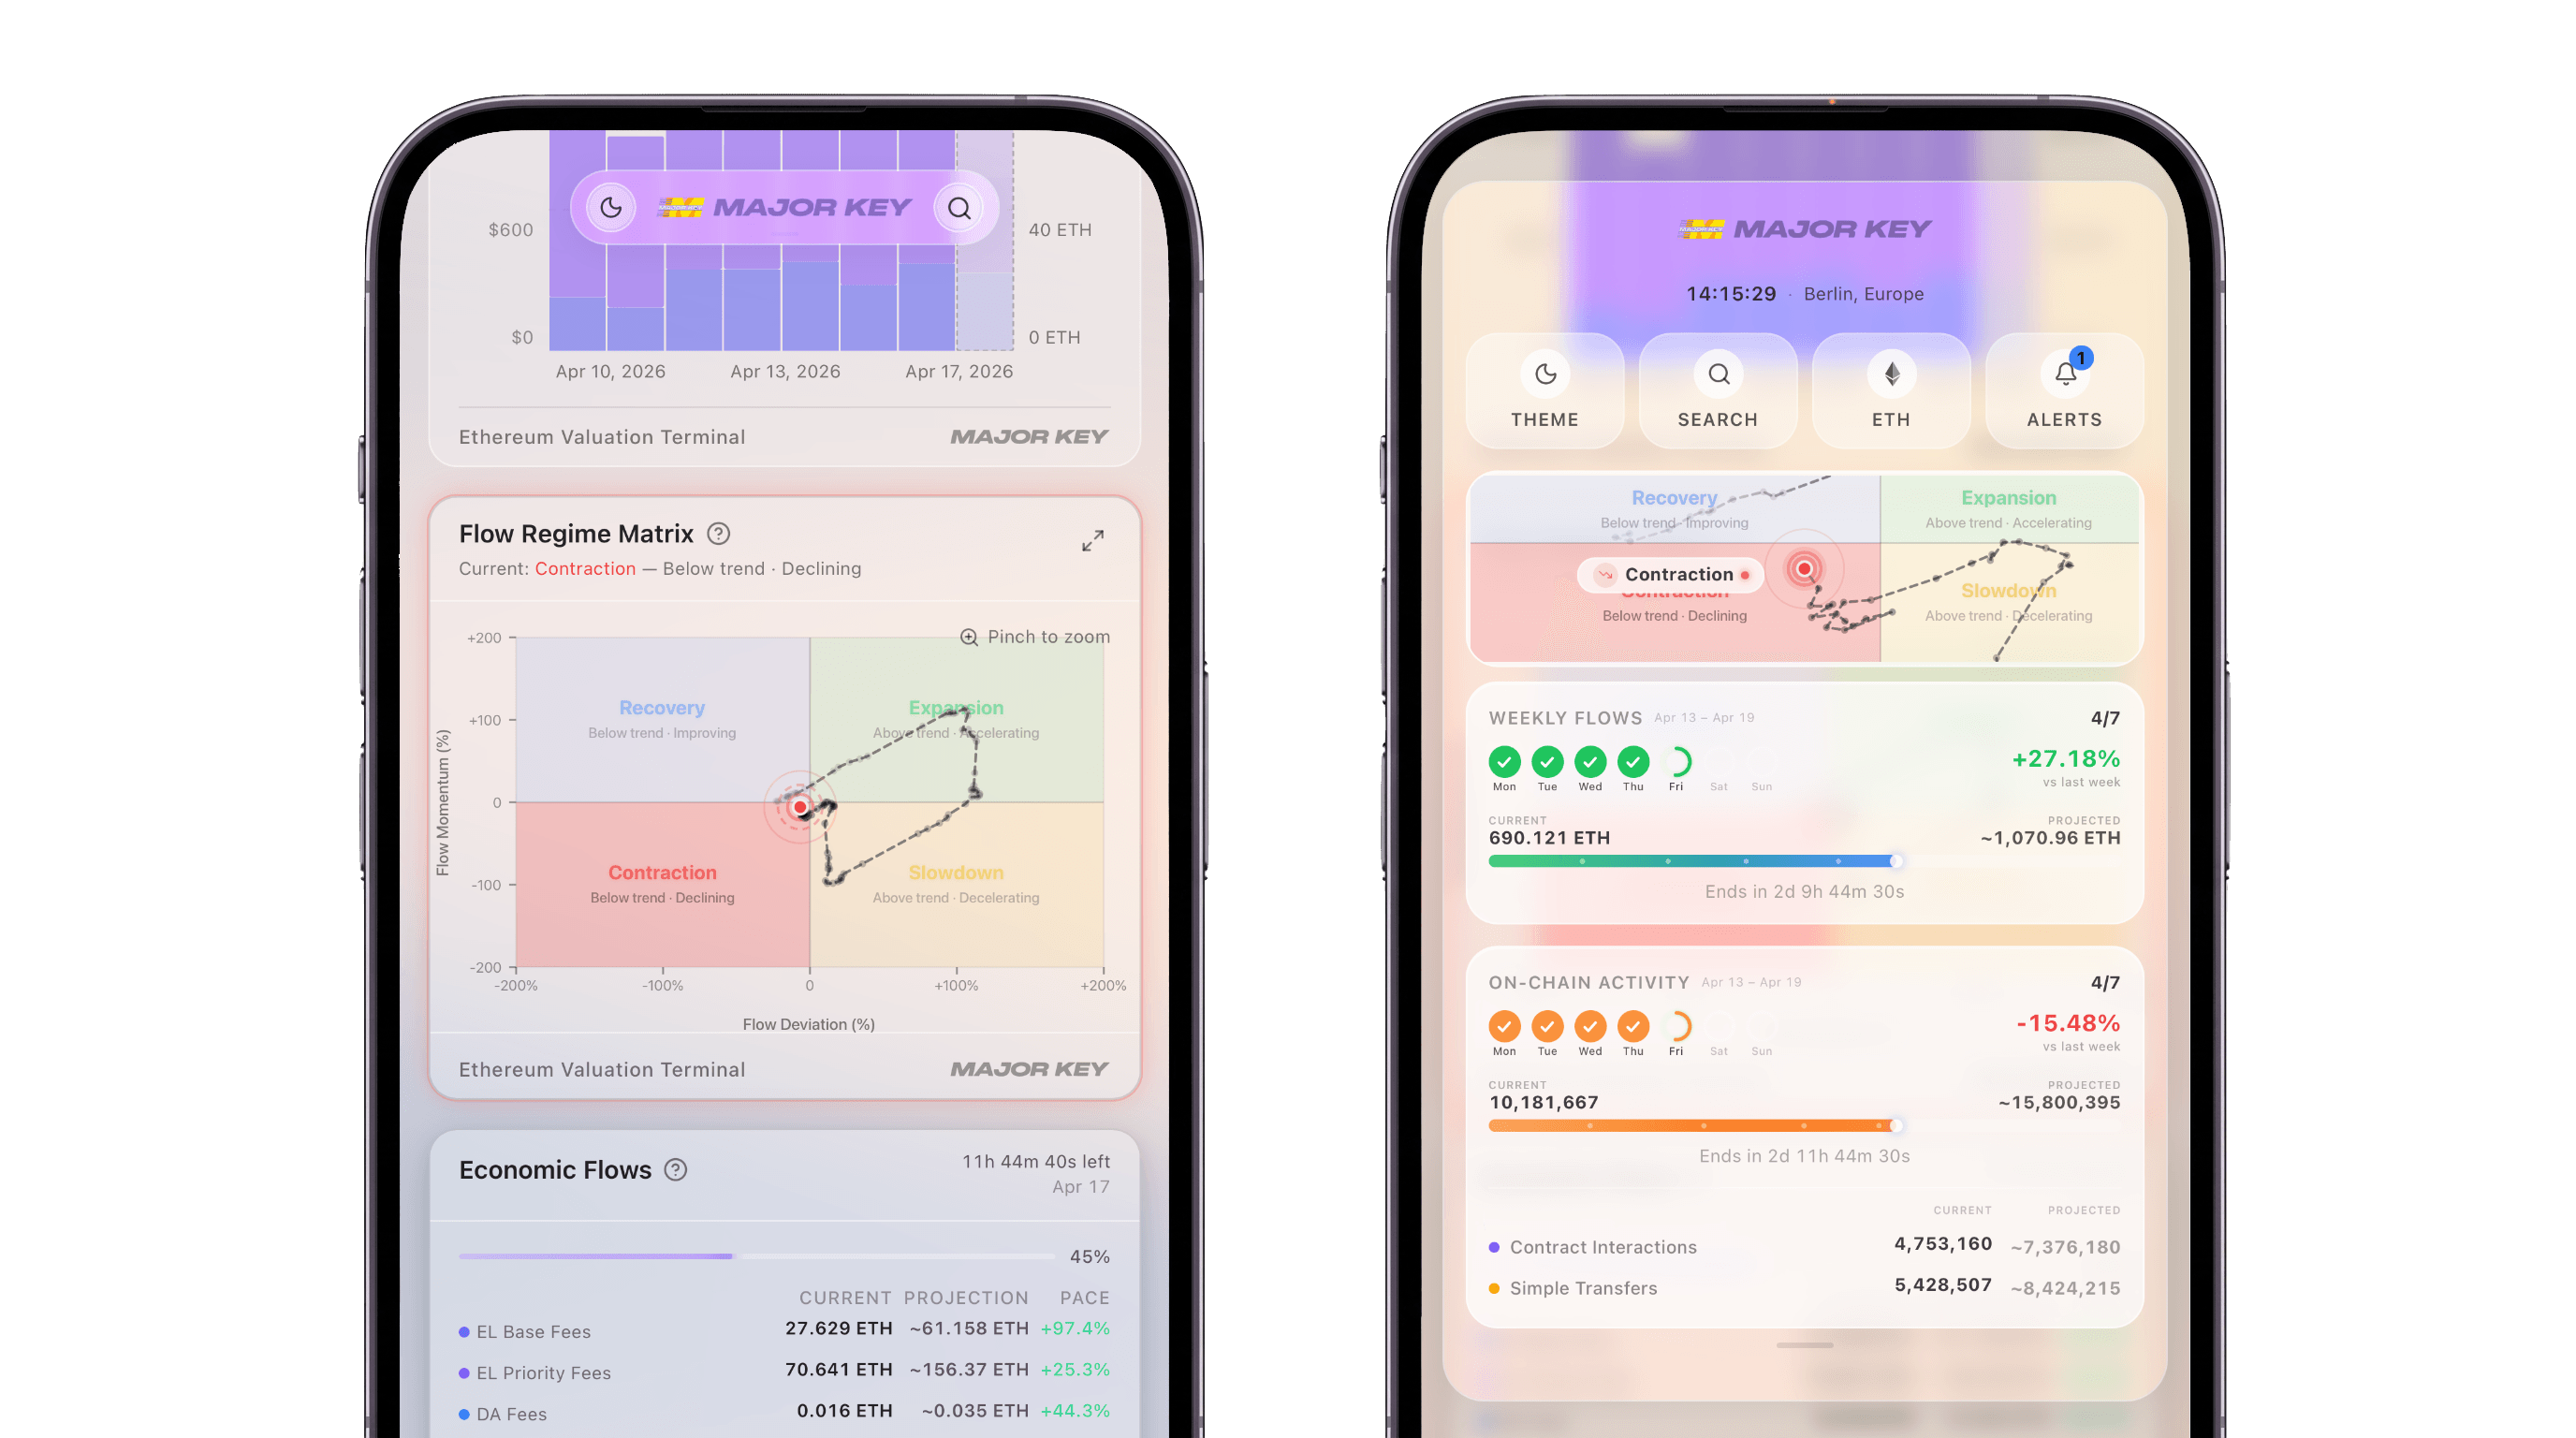
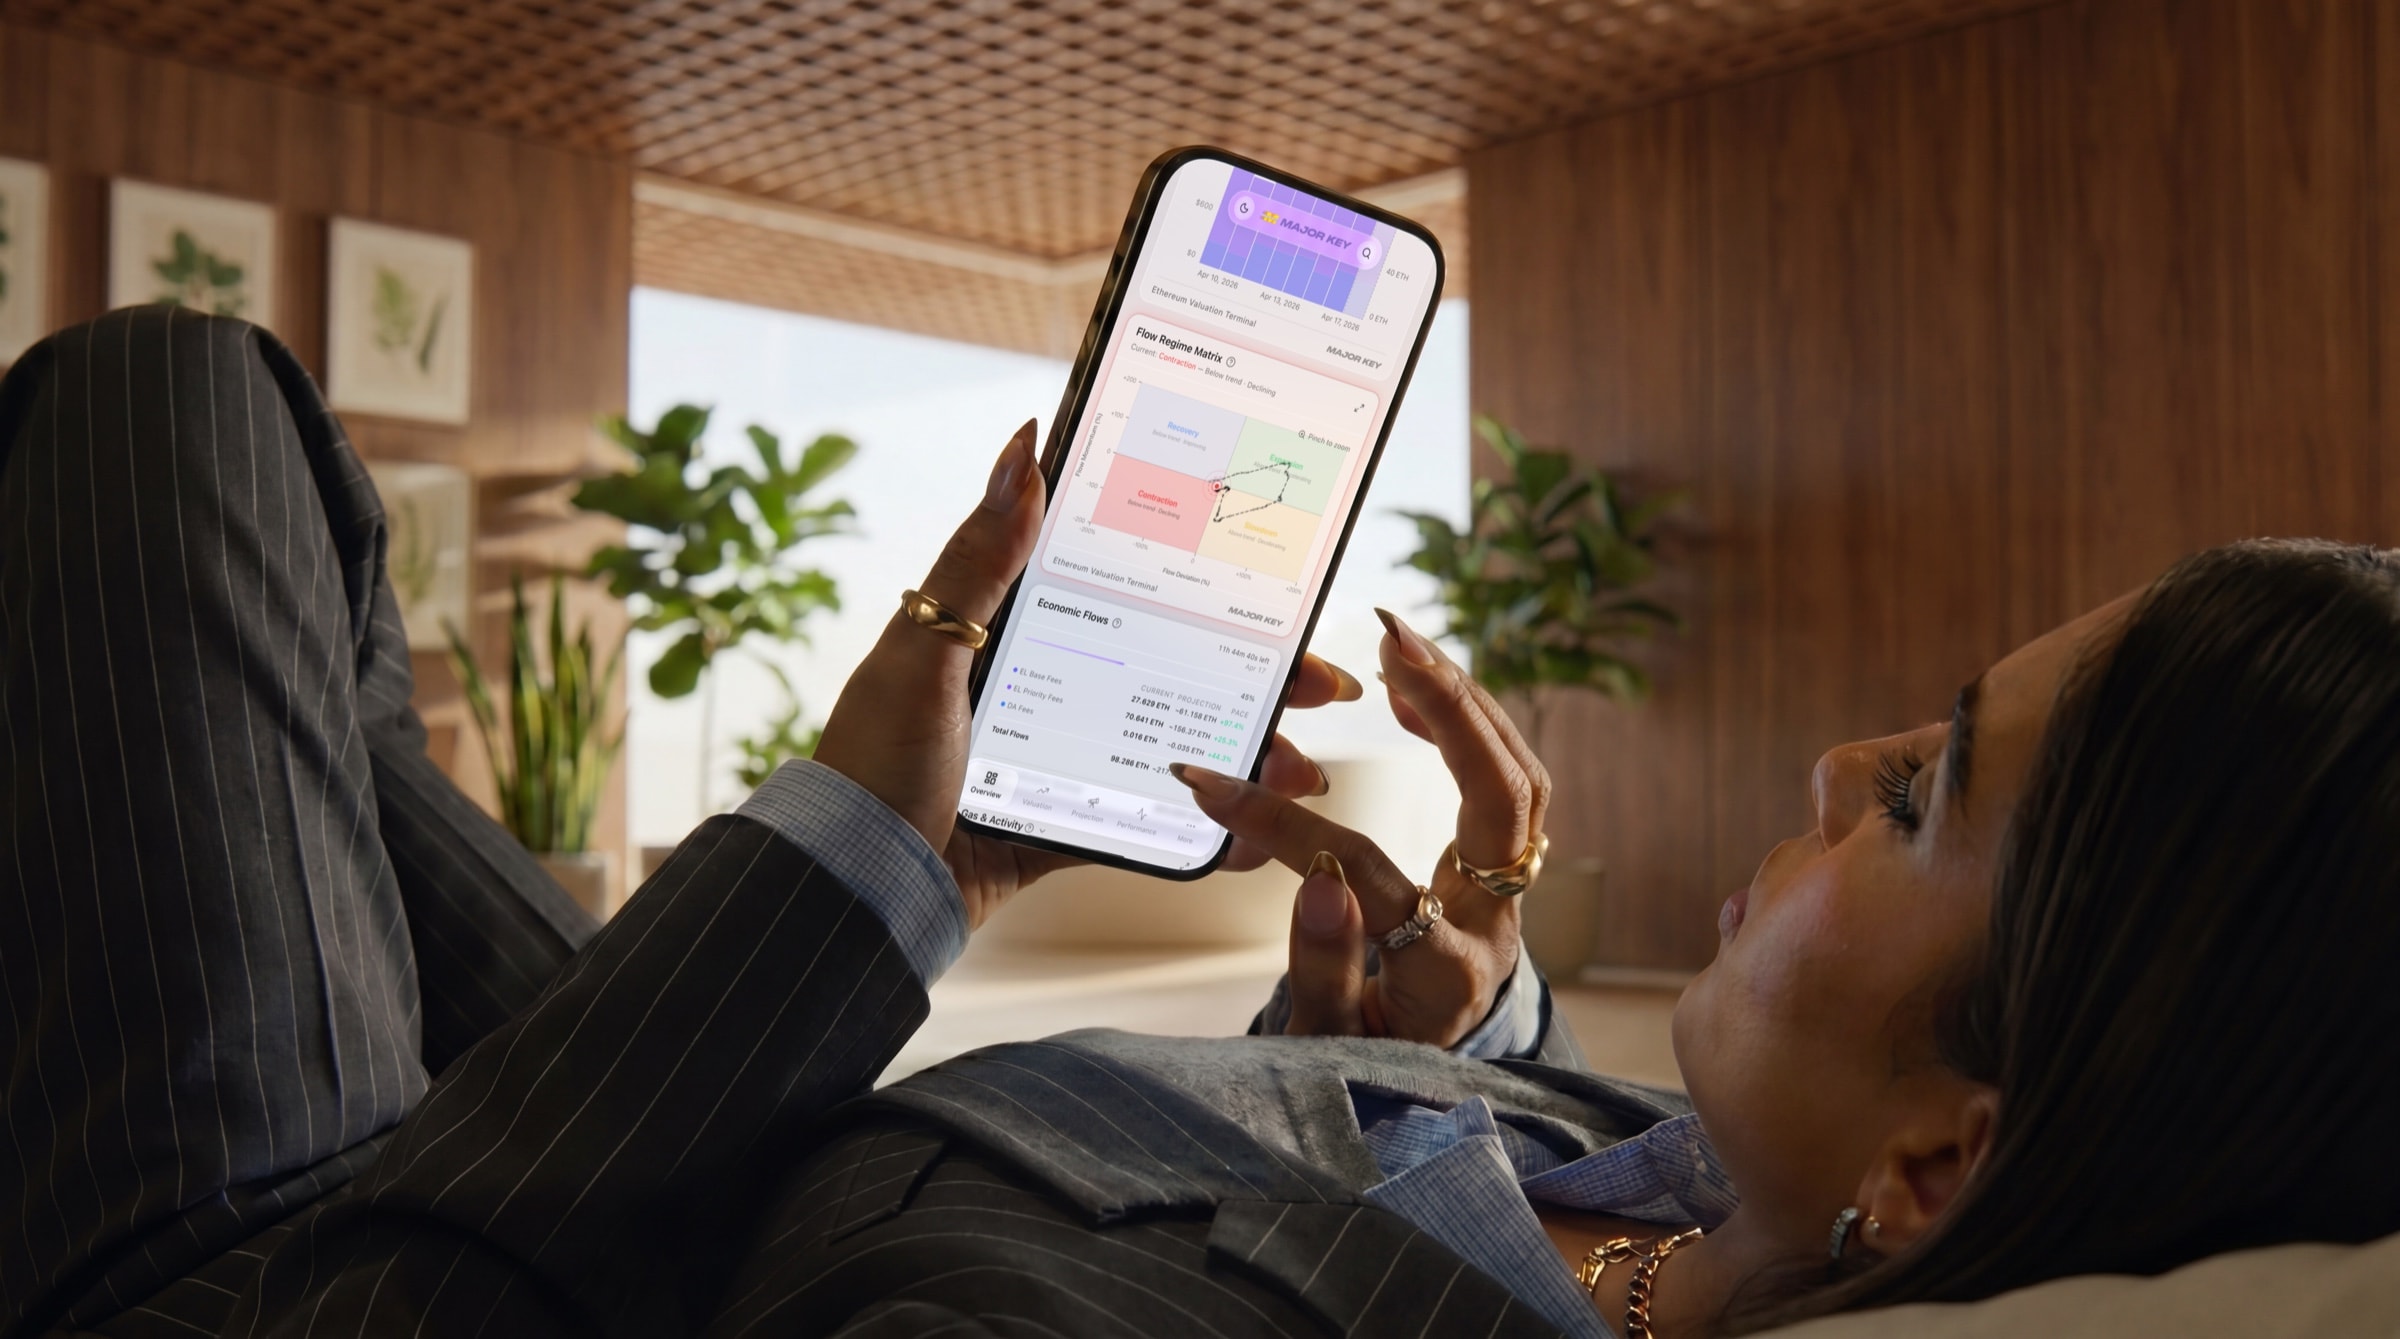
Research, on-chain telemetry, and fundamentals — flowing into a single science-backed fair value for ETH, refreshed every block, on the device that's already in your pocket.
// Side-by-side
Each tool, audited on the questions ETH allocators actually ask. Where a check or cross would flatten useful nuance, the cell carries a short factual line instead.
Sources verified — Q2 / 2026
1 / 3 · Premium research firms
How premium research firms package thesis, governance, and ecosystem narrative for ETH allocators.
Swipe table sideways to compare all tools →
2 / 3 · On-chain analytics terminals
How analytics terminals turn live blockchain telemetry into wallet flows, exchange data, and on-chain ratios.
Swipe table sideways to compare all tools →
3 / 3 · Fundamentals & tokenomics data
How fundamentals aggregators standardise TVL, fees, revenue, and cross-chain comparables across ecosystems.
Swipe table sideways to compare all tools →
Every cell is judged on what each tool publishes about itself (pricing pages, product pages, public docs). No third-party reviews were used to score competitors.
See how the methods themselves compare →
Why we built it this way
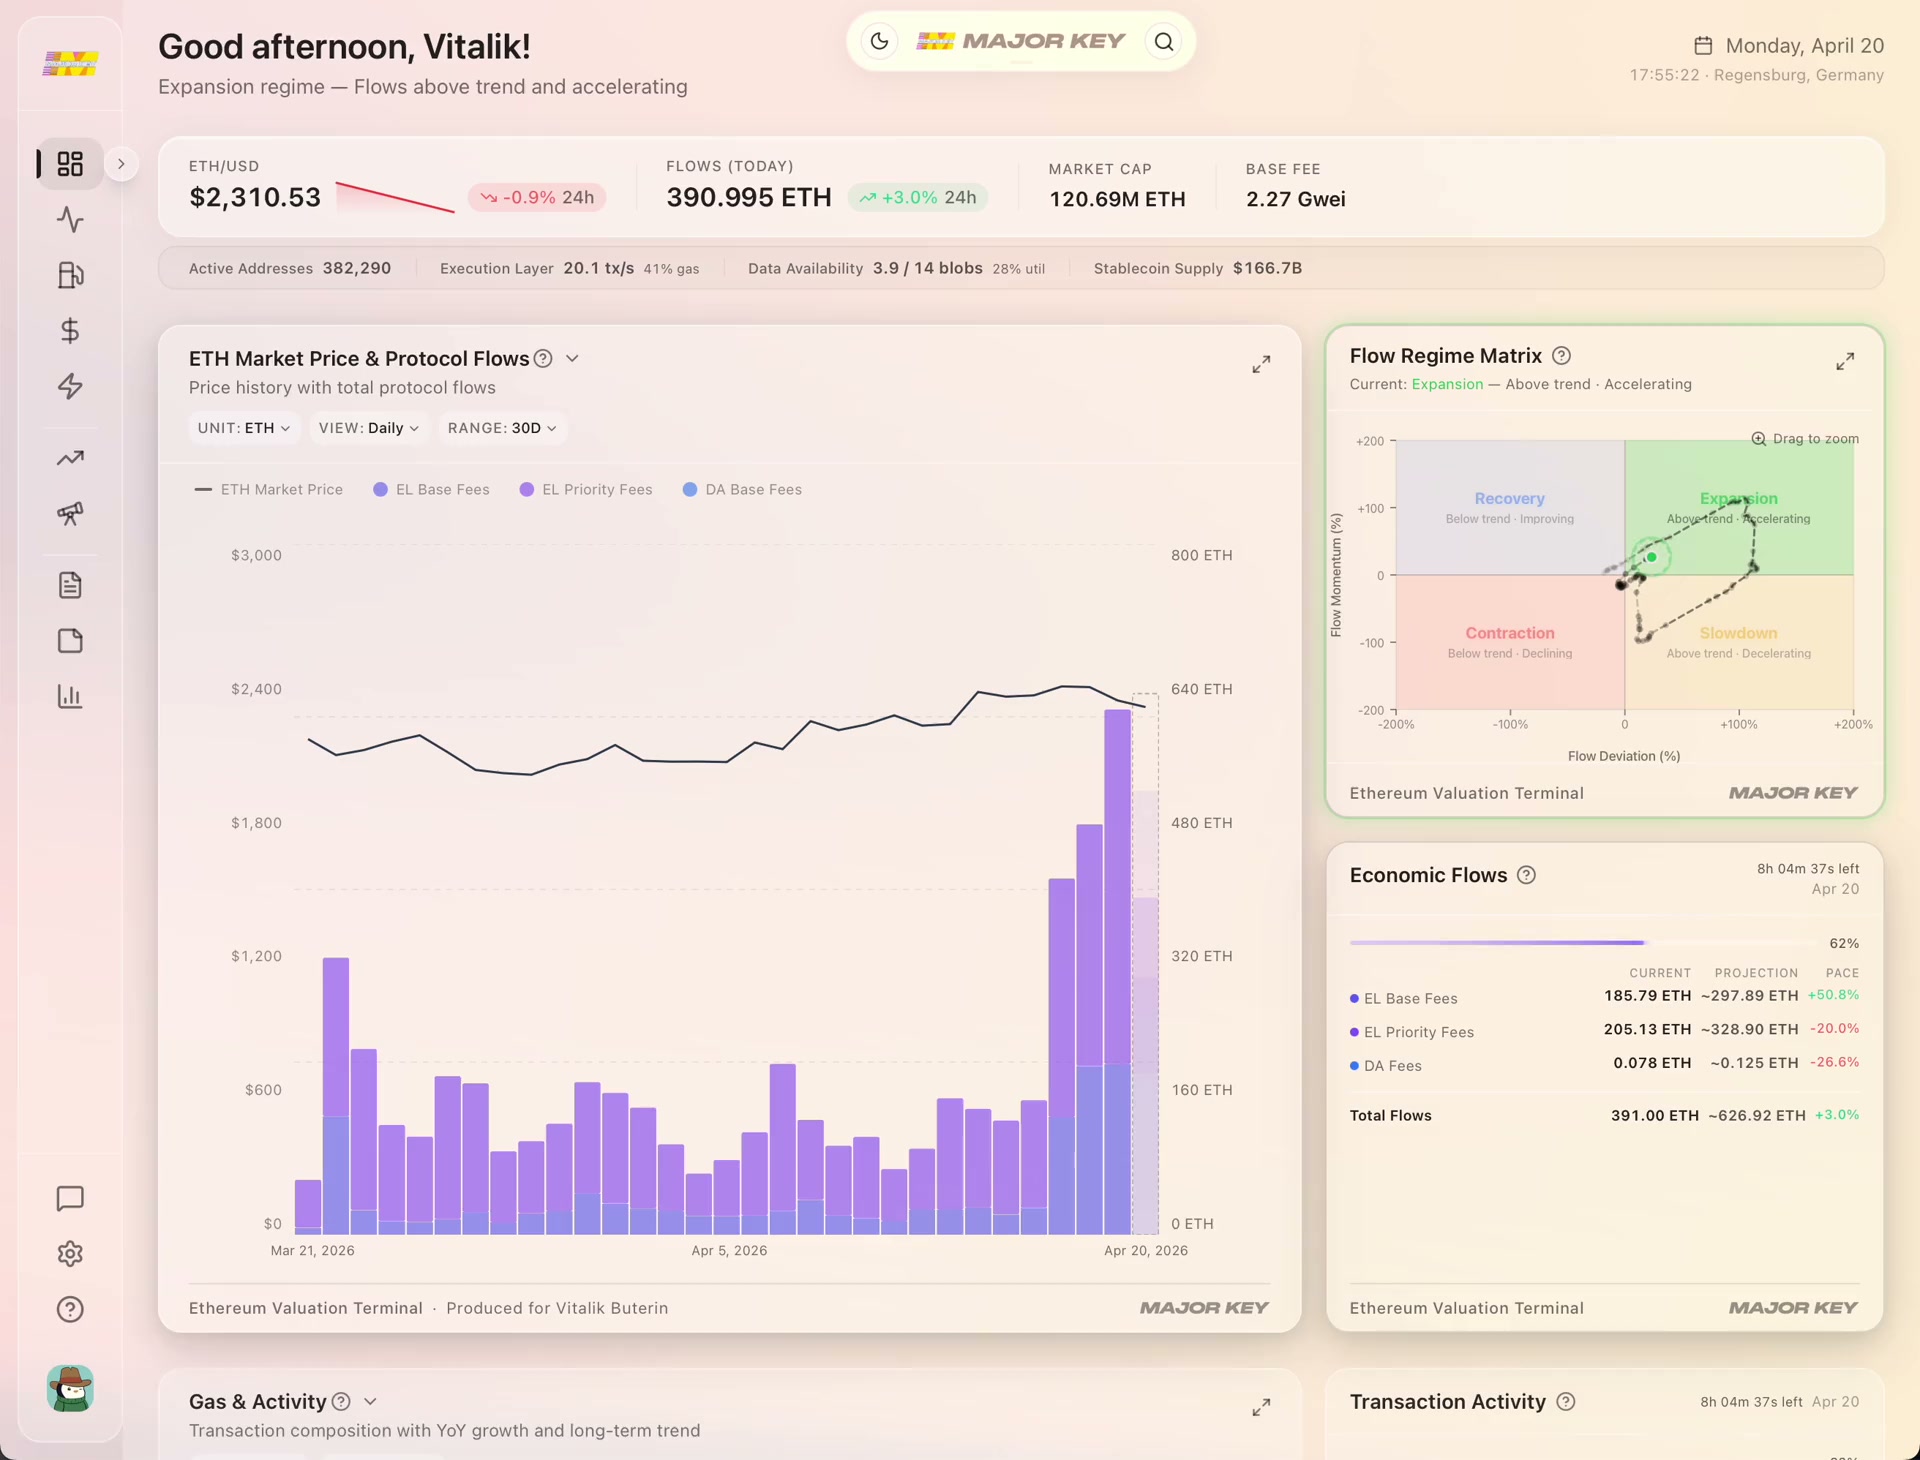
The terminal does one thing the twelve tools above don't: publish a science-backed real-time fair value for ETH. Below is the live model — Flow Intensity, Flow Deviation, implied fair value, updated every block.

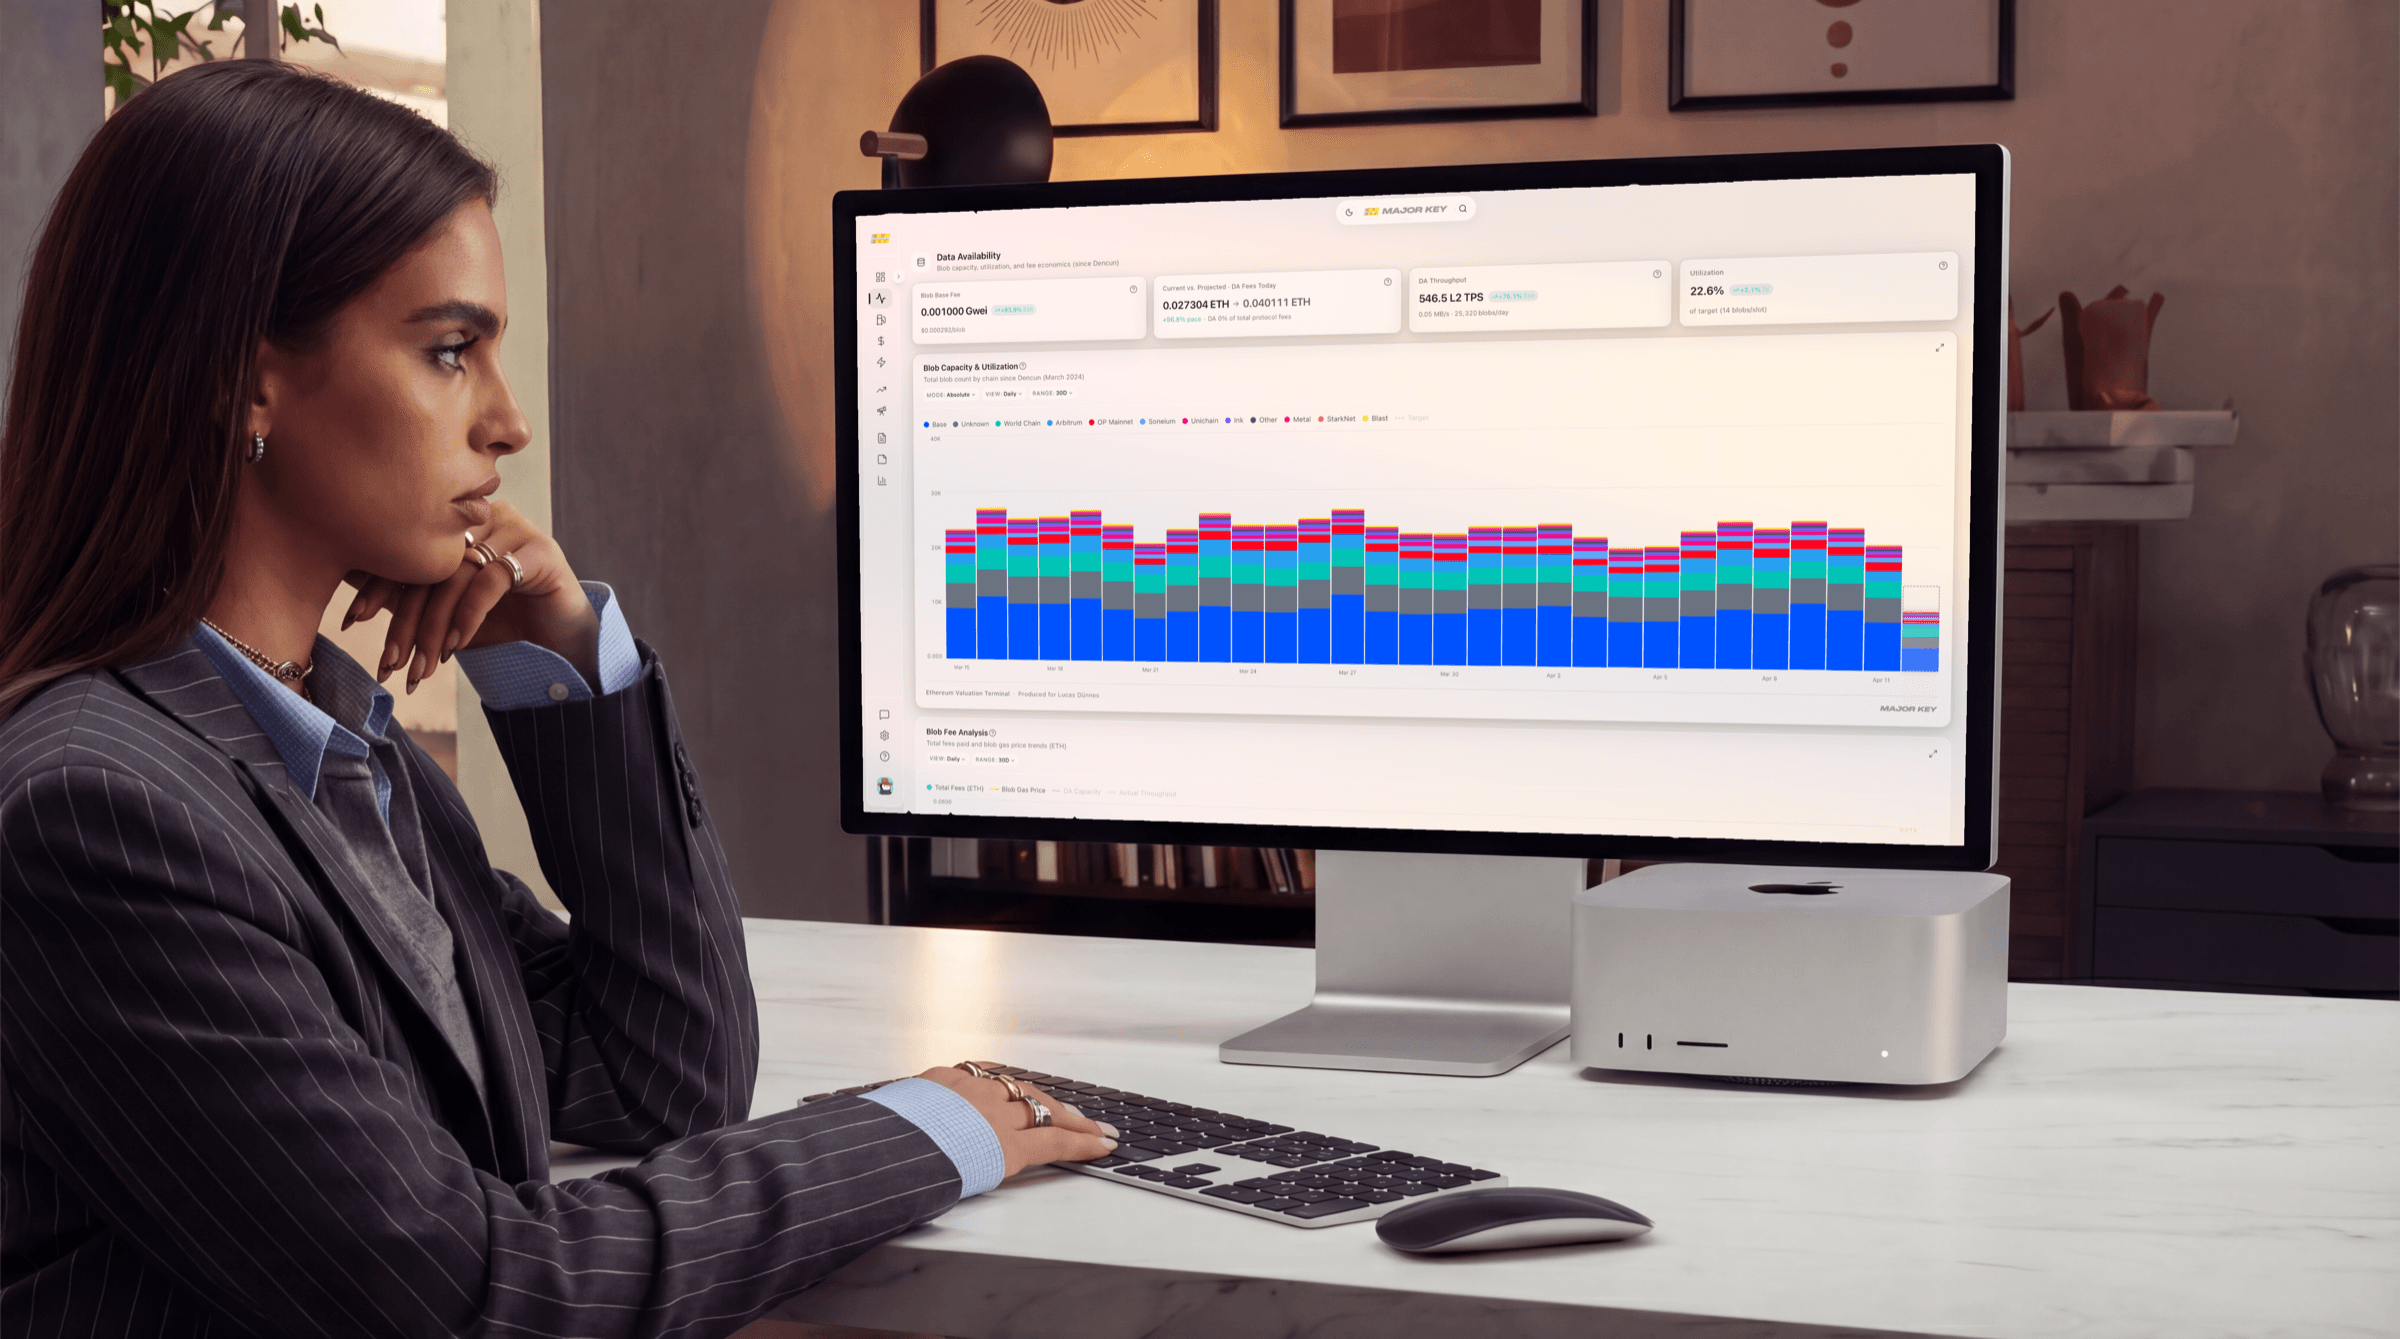
The Ethereum Valuation Terminal — Flow Intensity, Flow Deviation, and implied fair value, updated every block.
76.4%
Out-of-sample directional accuracy
Naive benchmark: 35.5% · +41 pp lift
22.8%
Peak in-sample R²
At the 45-day return horizon
Management Science
Working paper, under review
Dünnes & Felsenstein-Eckberg

Common questions
If you're comparing the terminal against the twelve tools above, these are the objections worth raising — and our honest answers.