


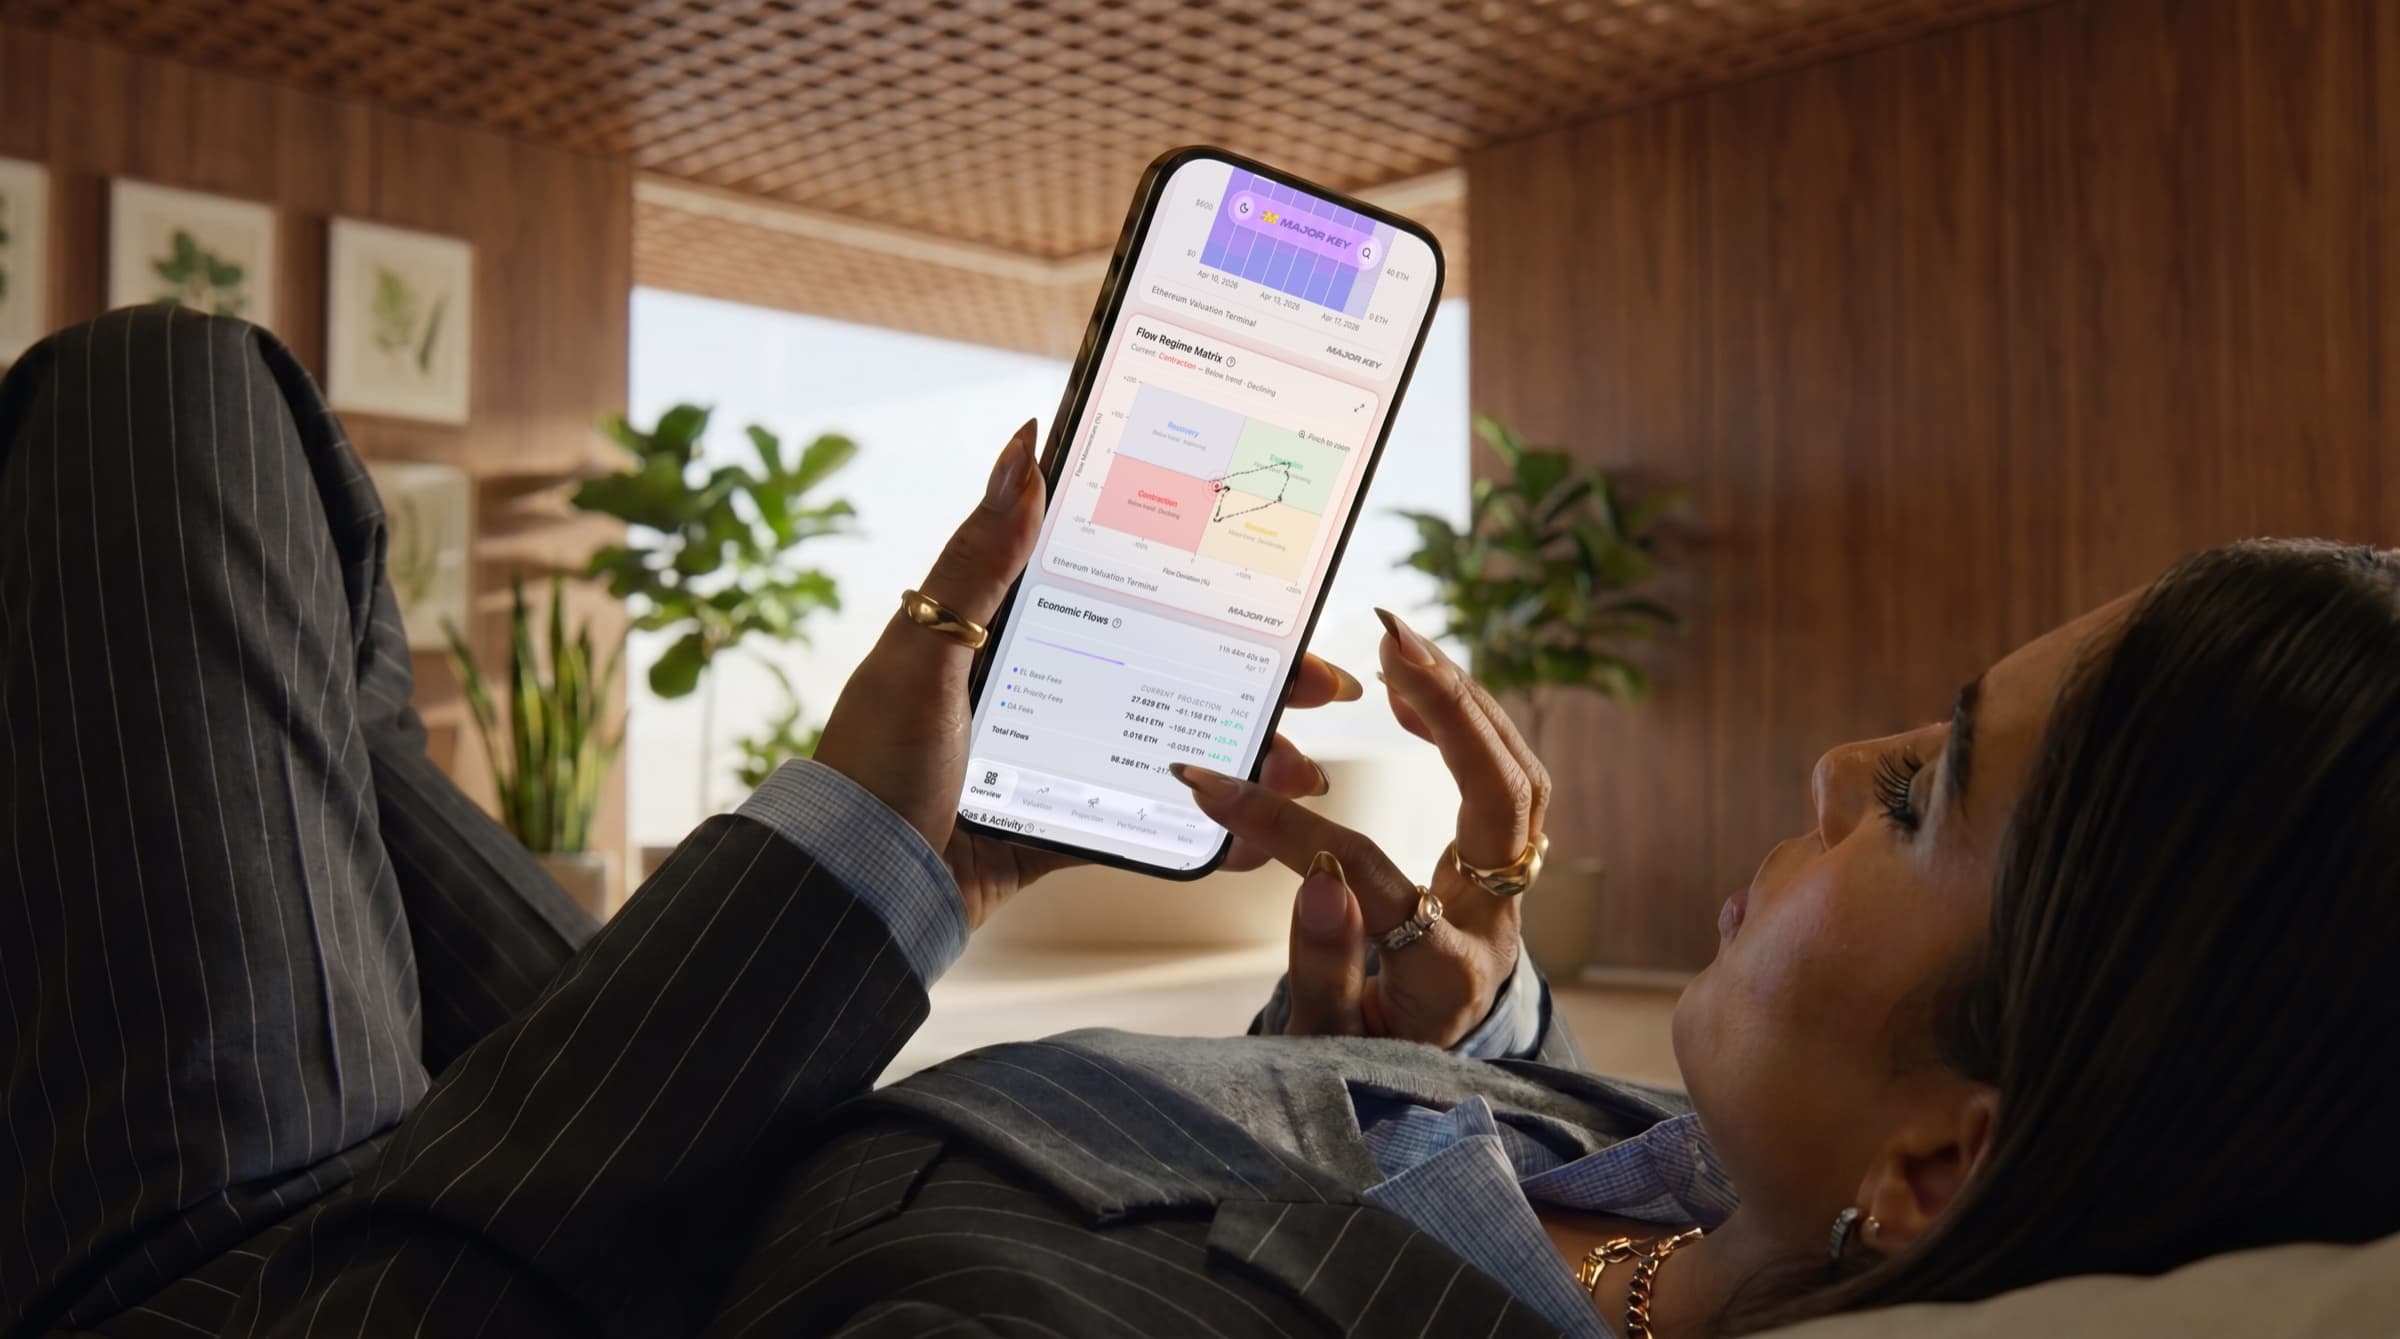
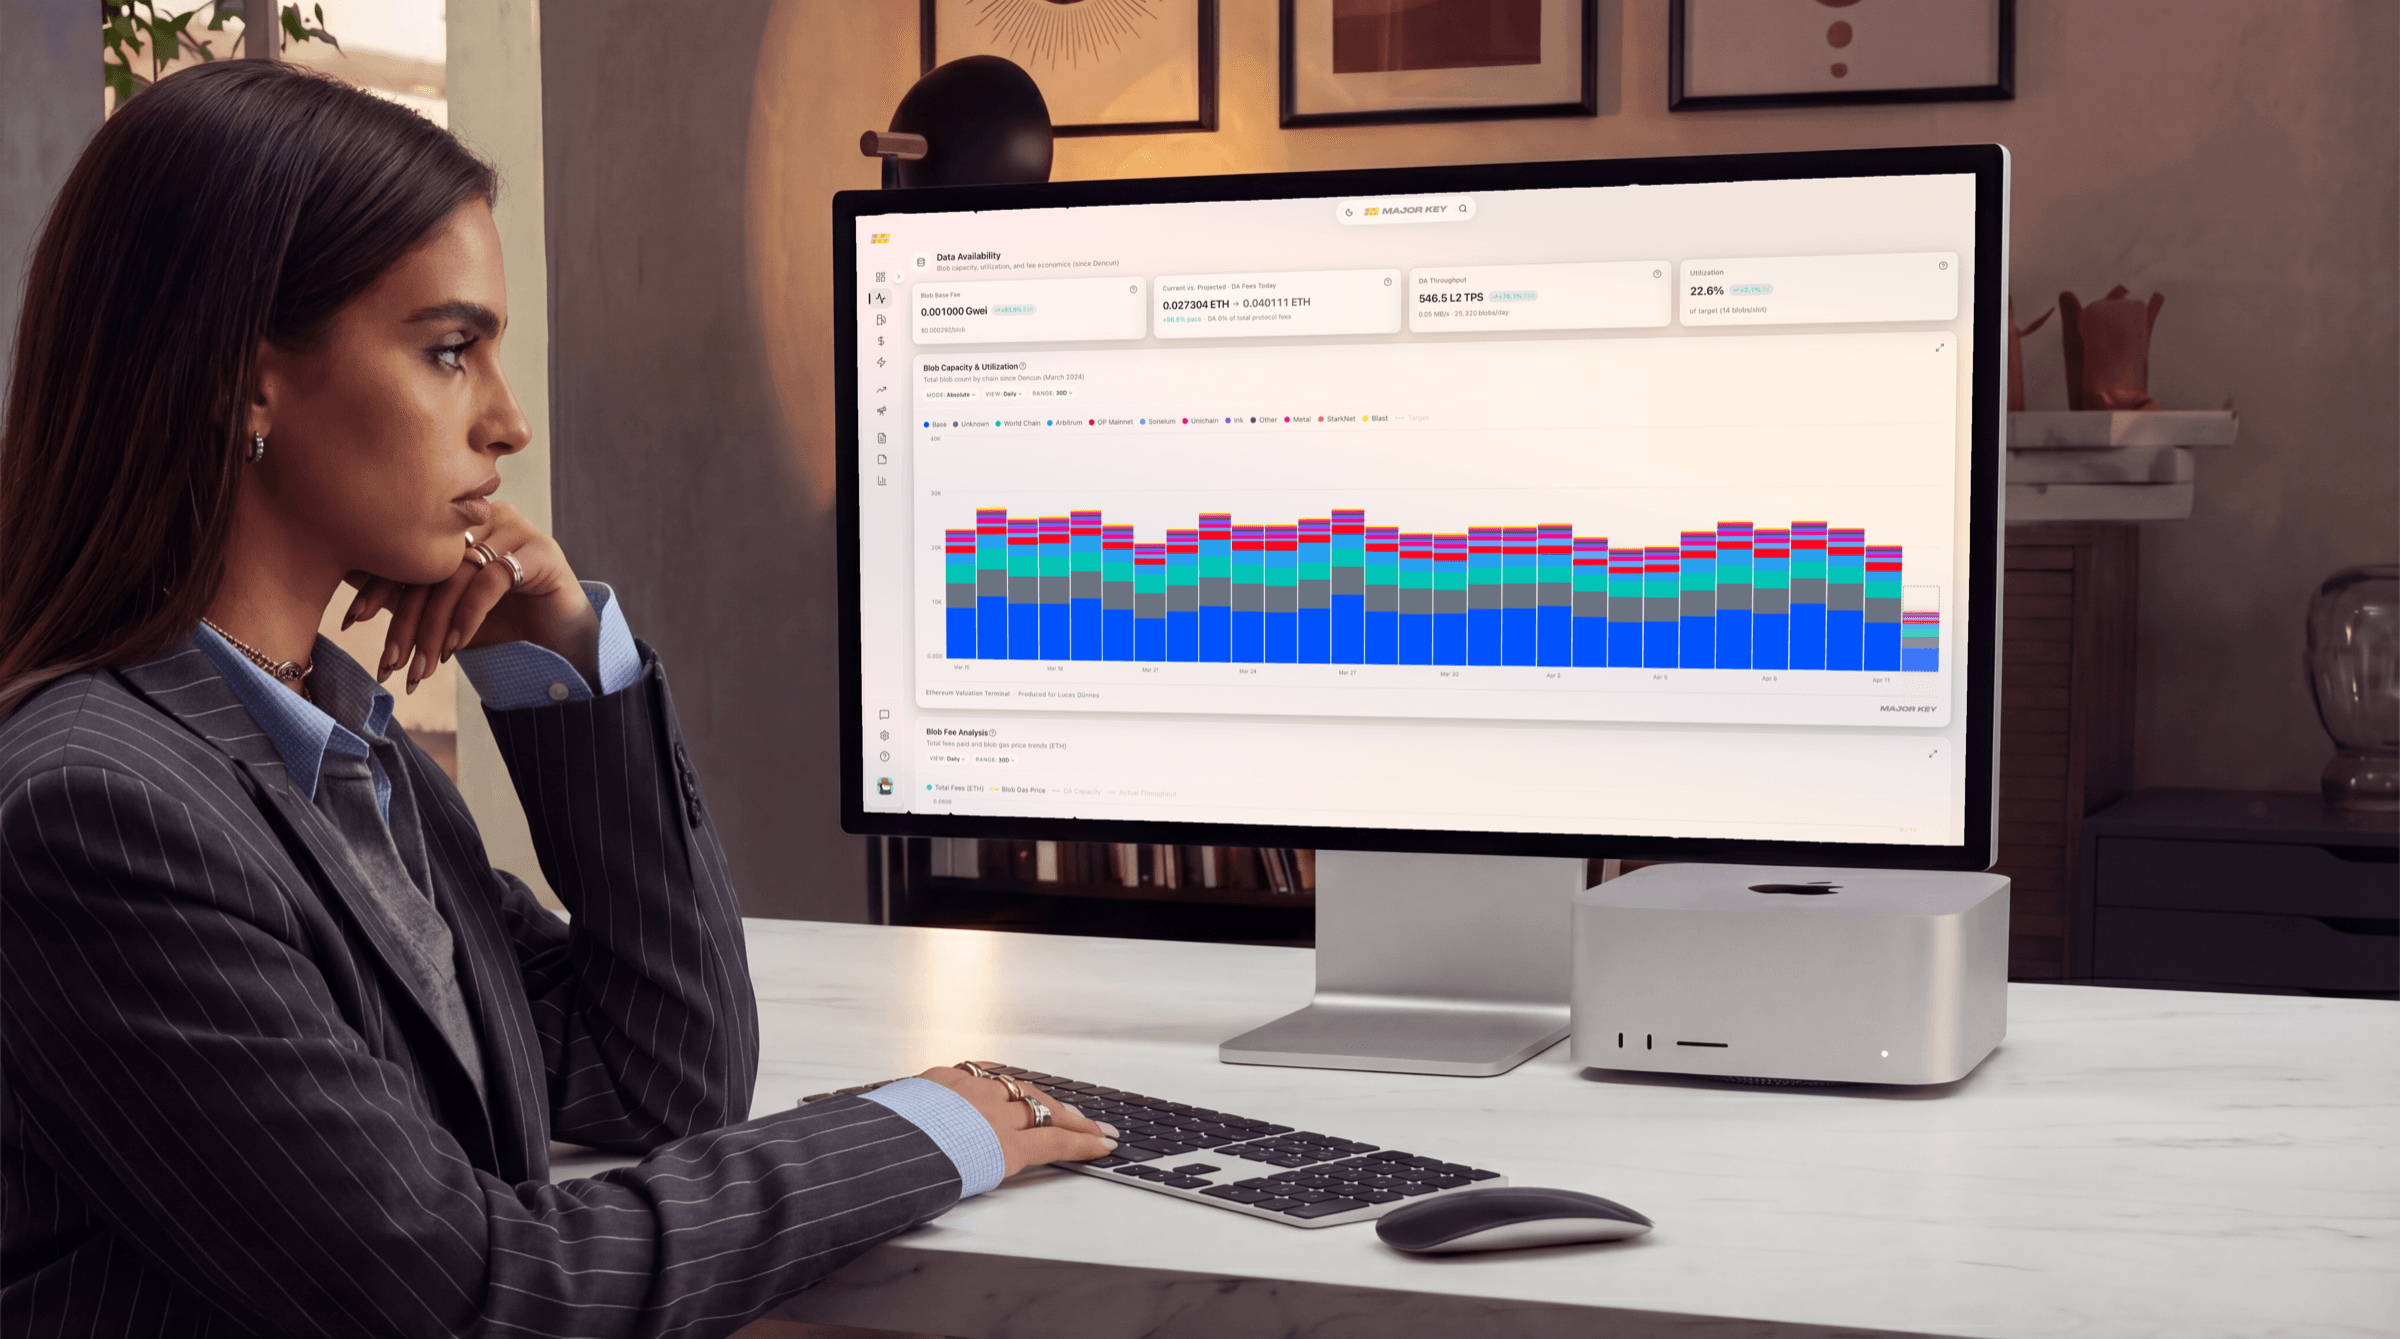
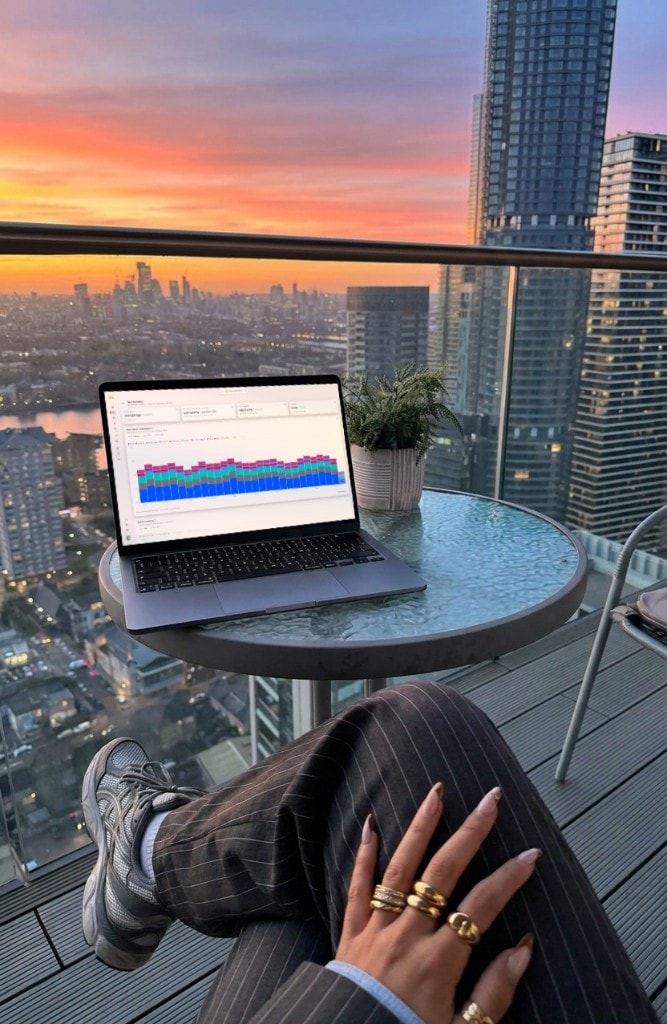
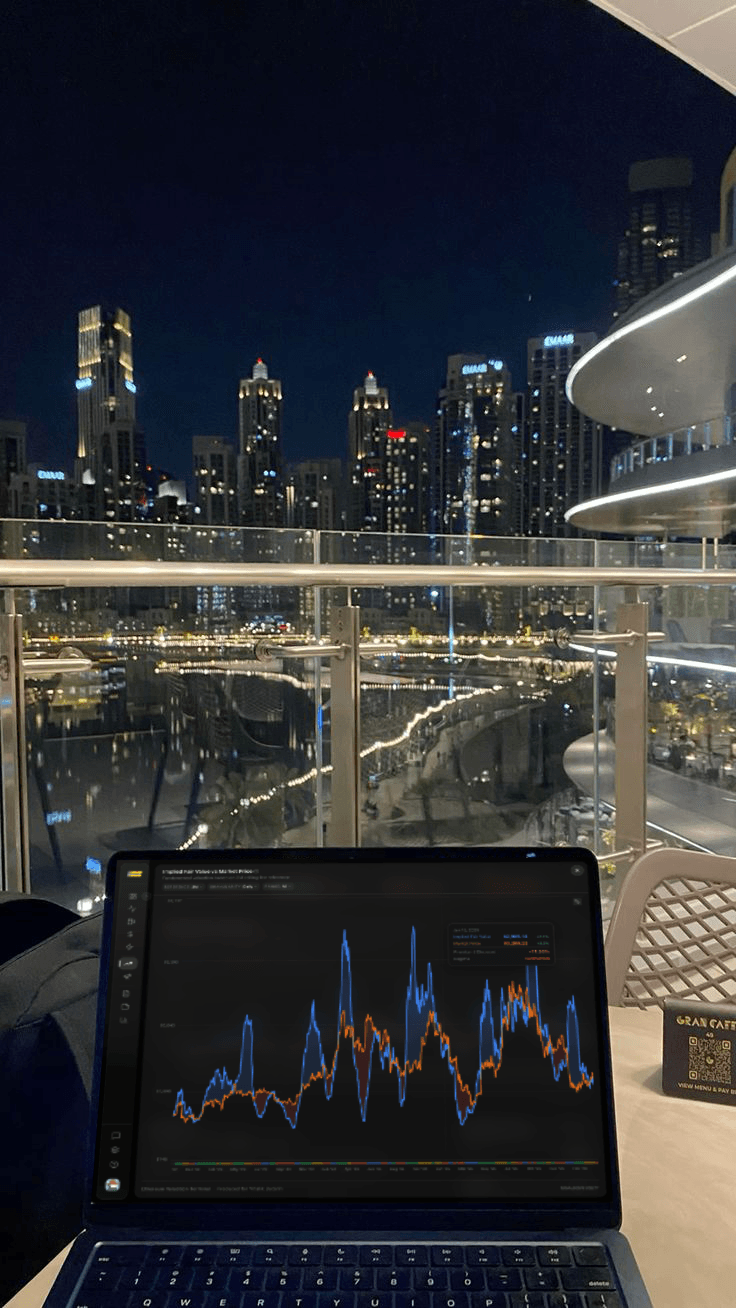
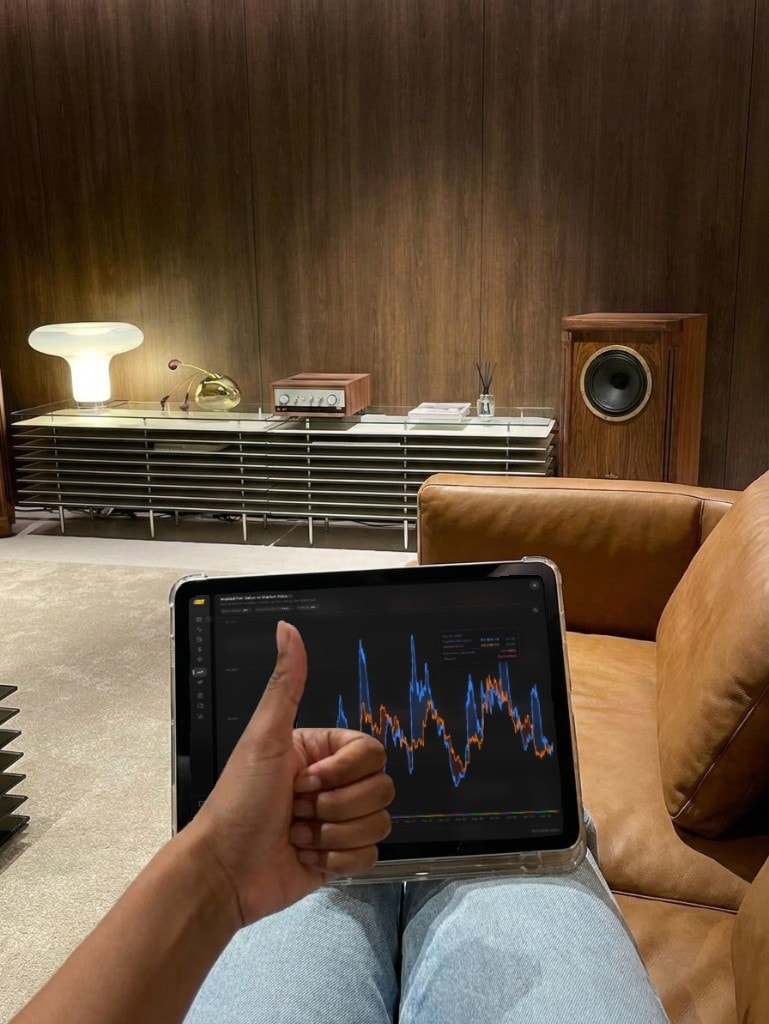
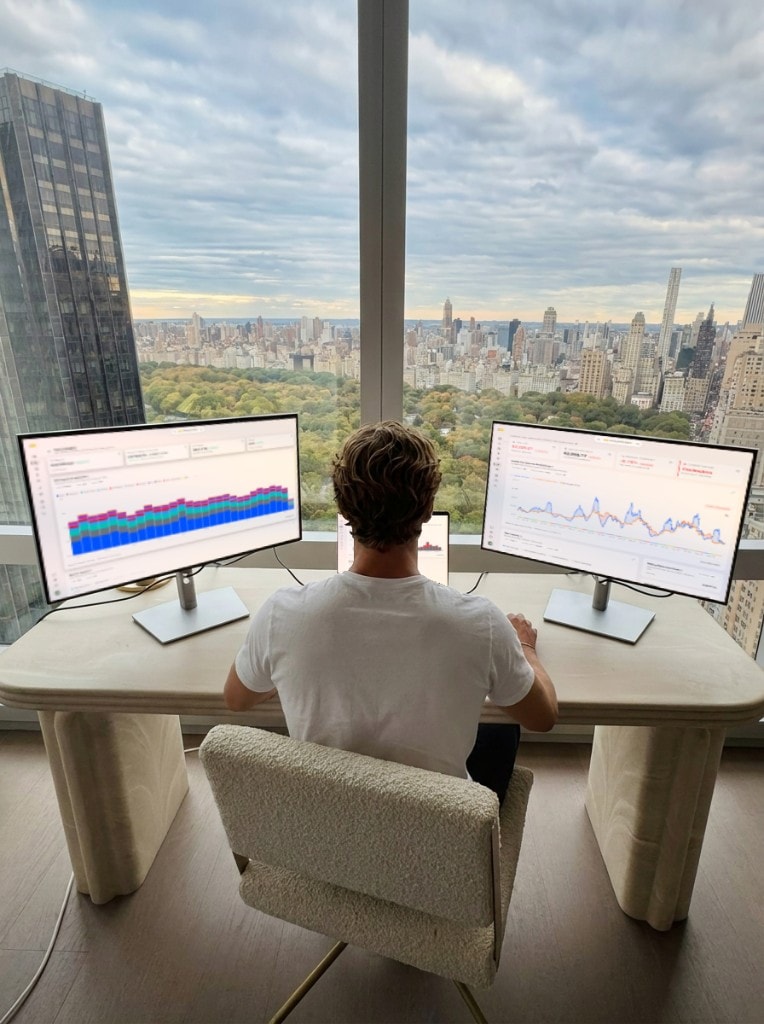
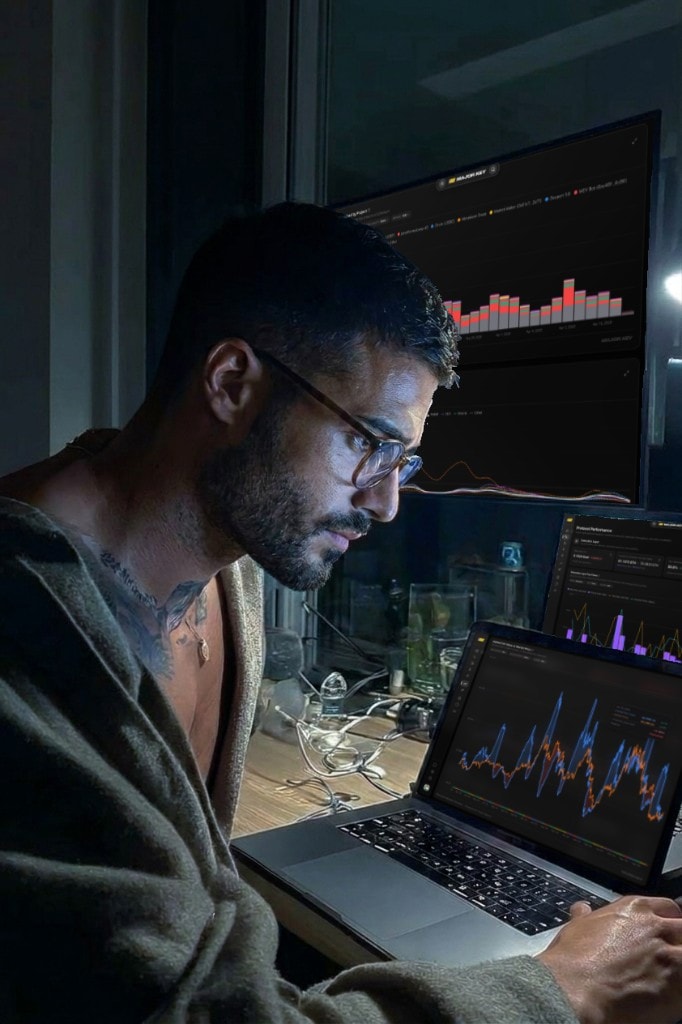
Real-time analytical platform for all devices
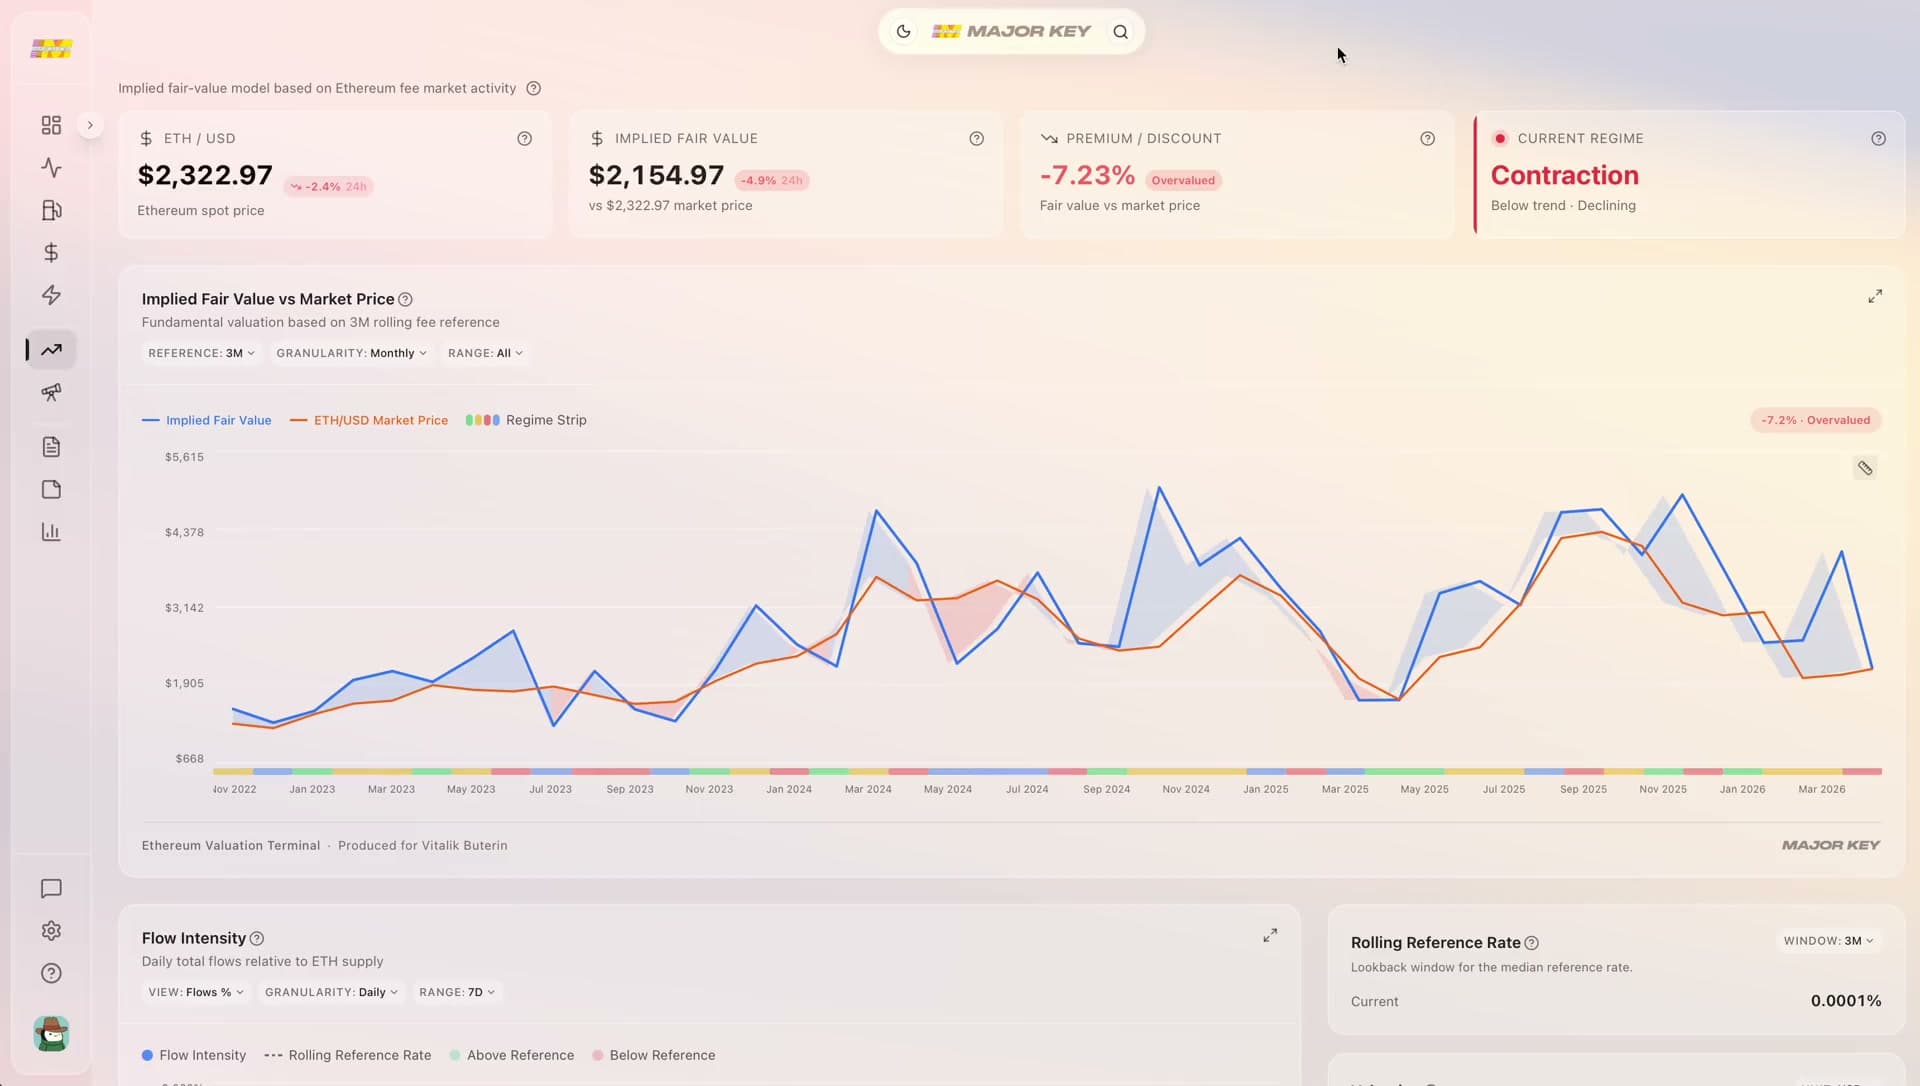
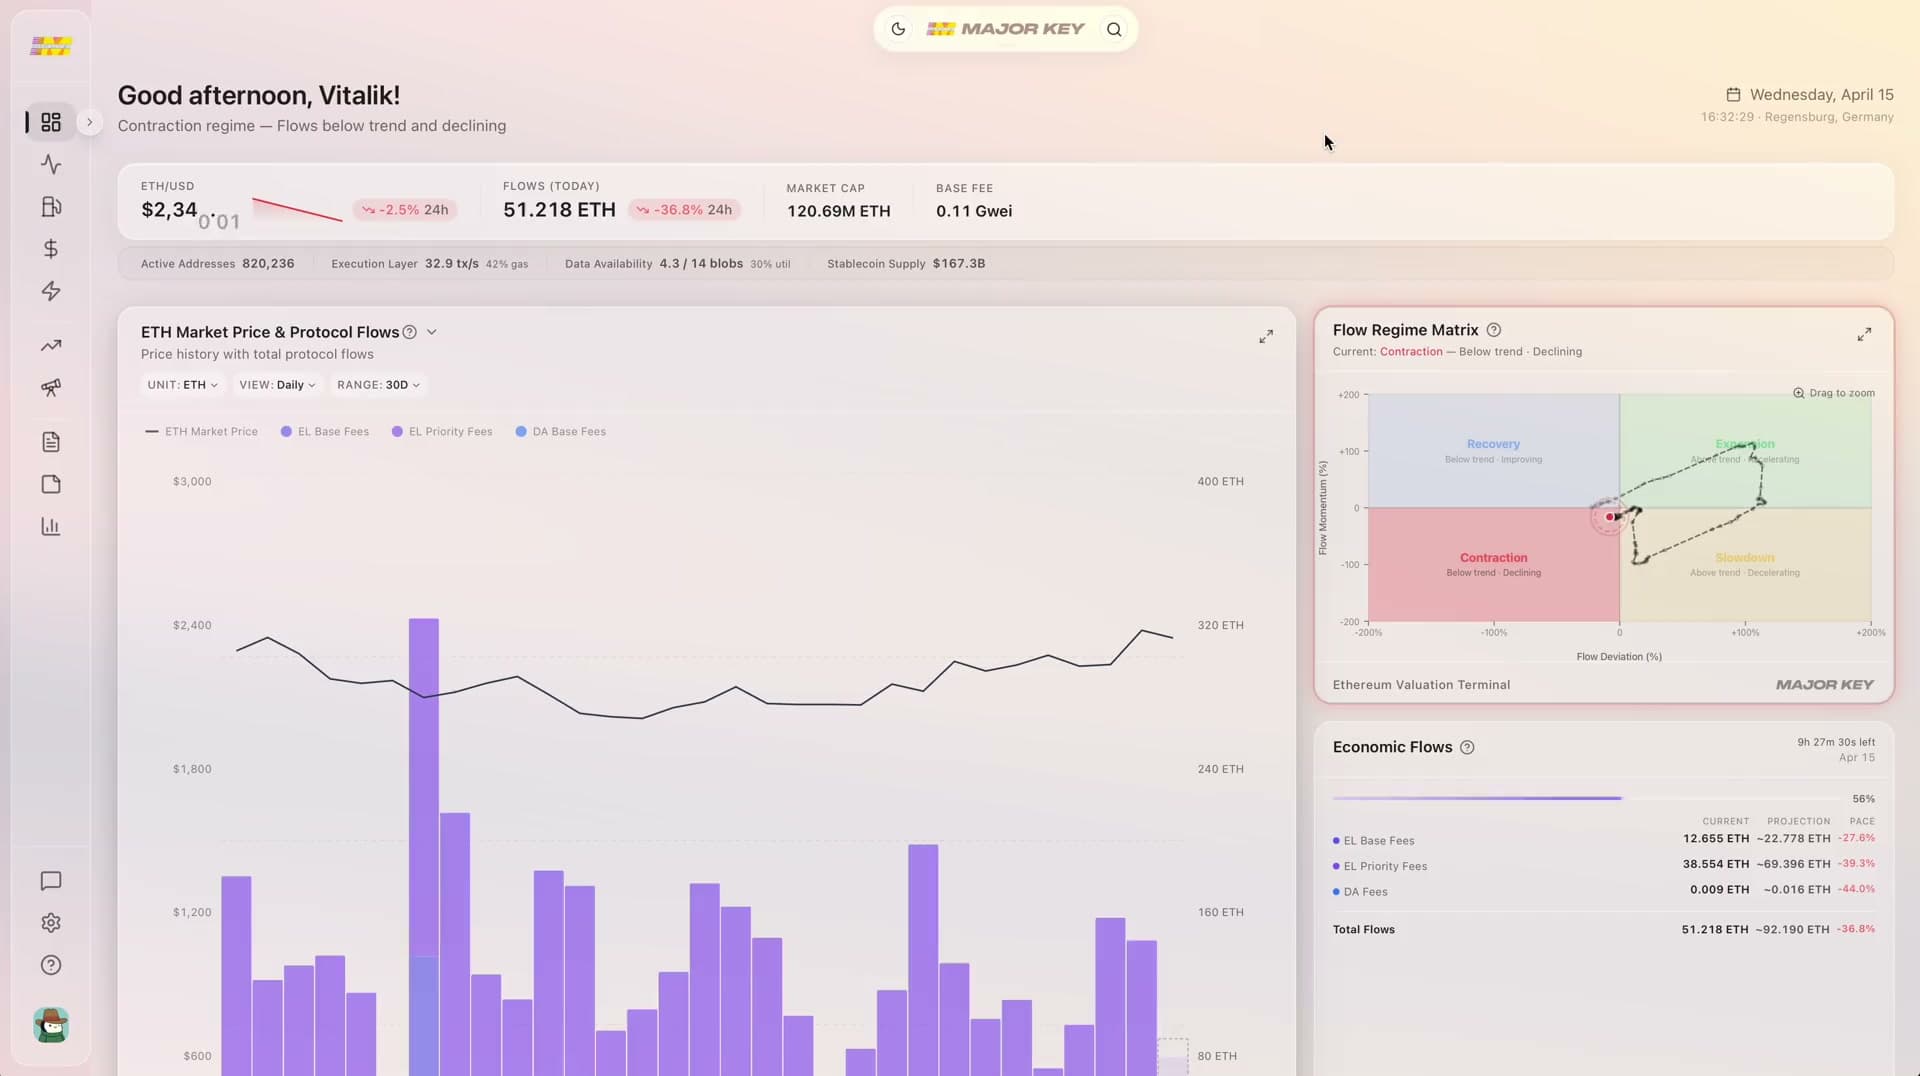
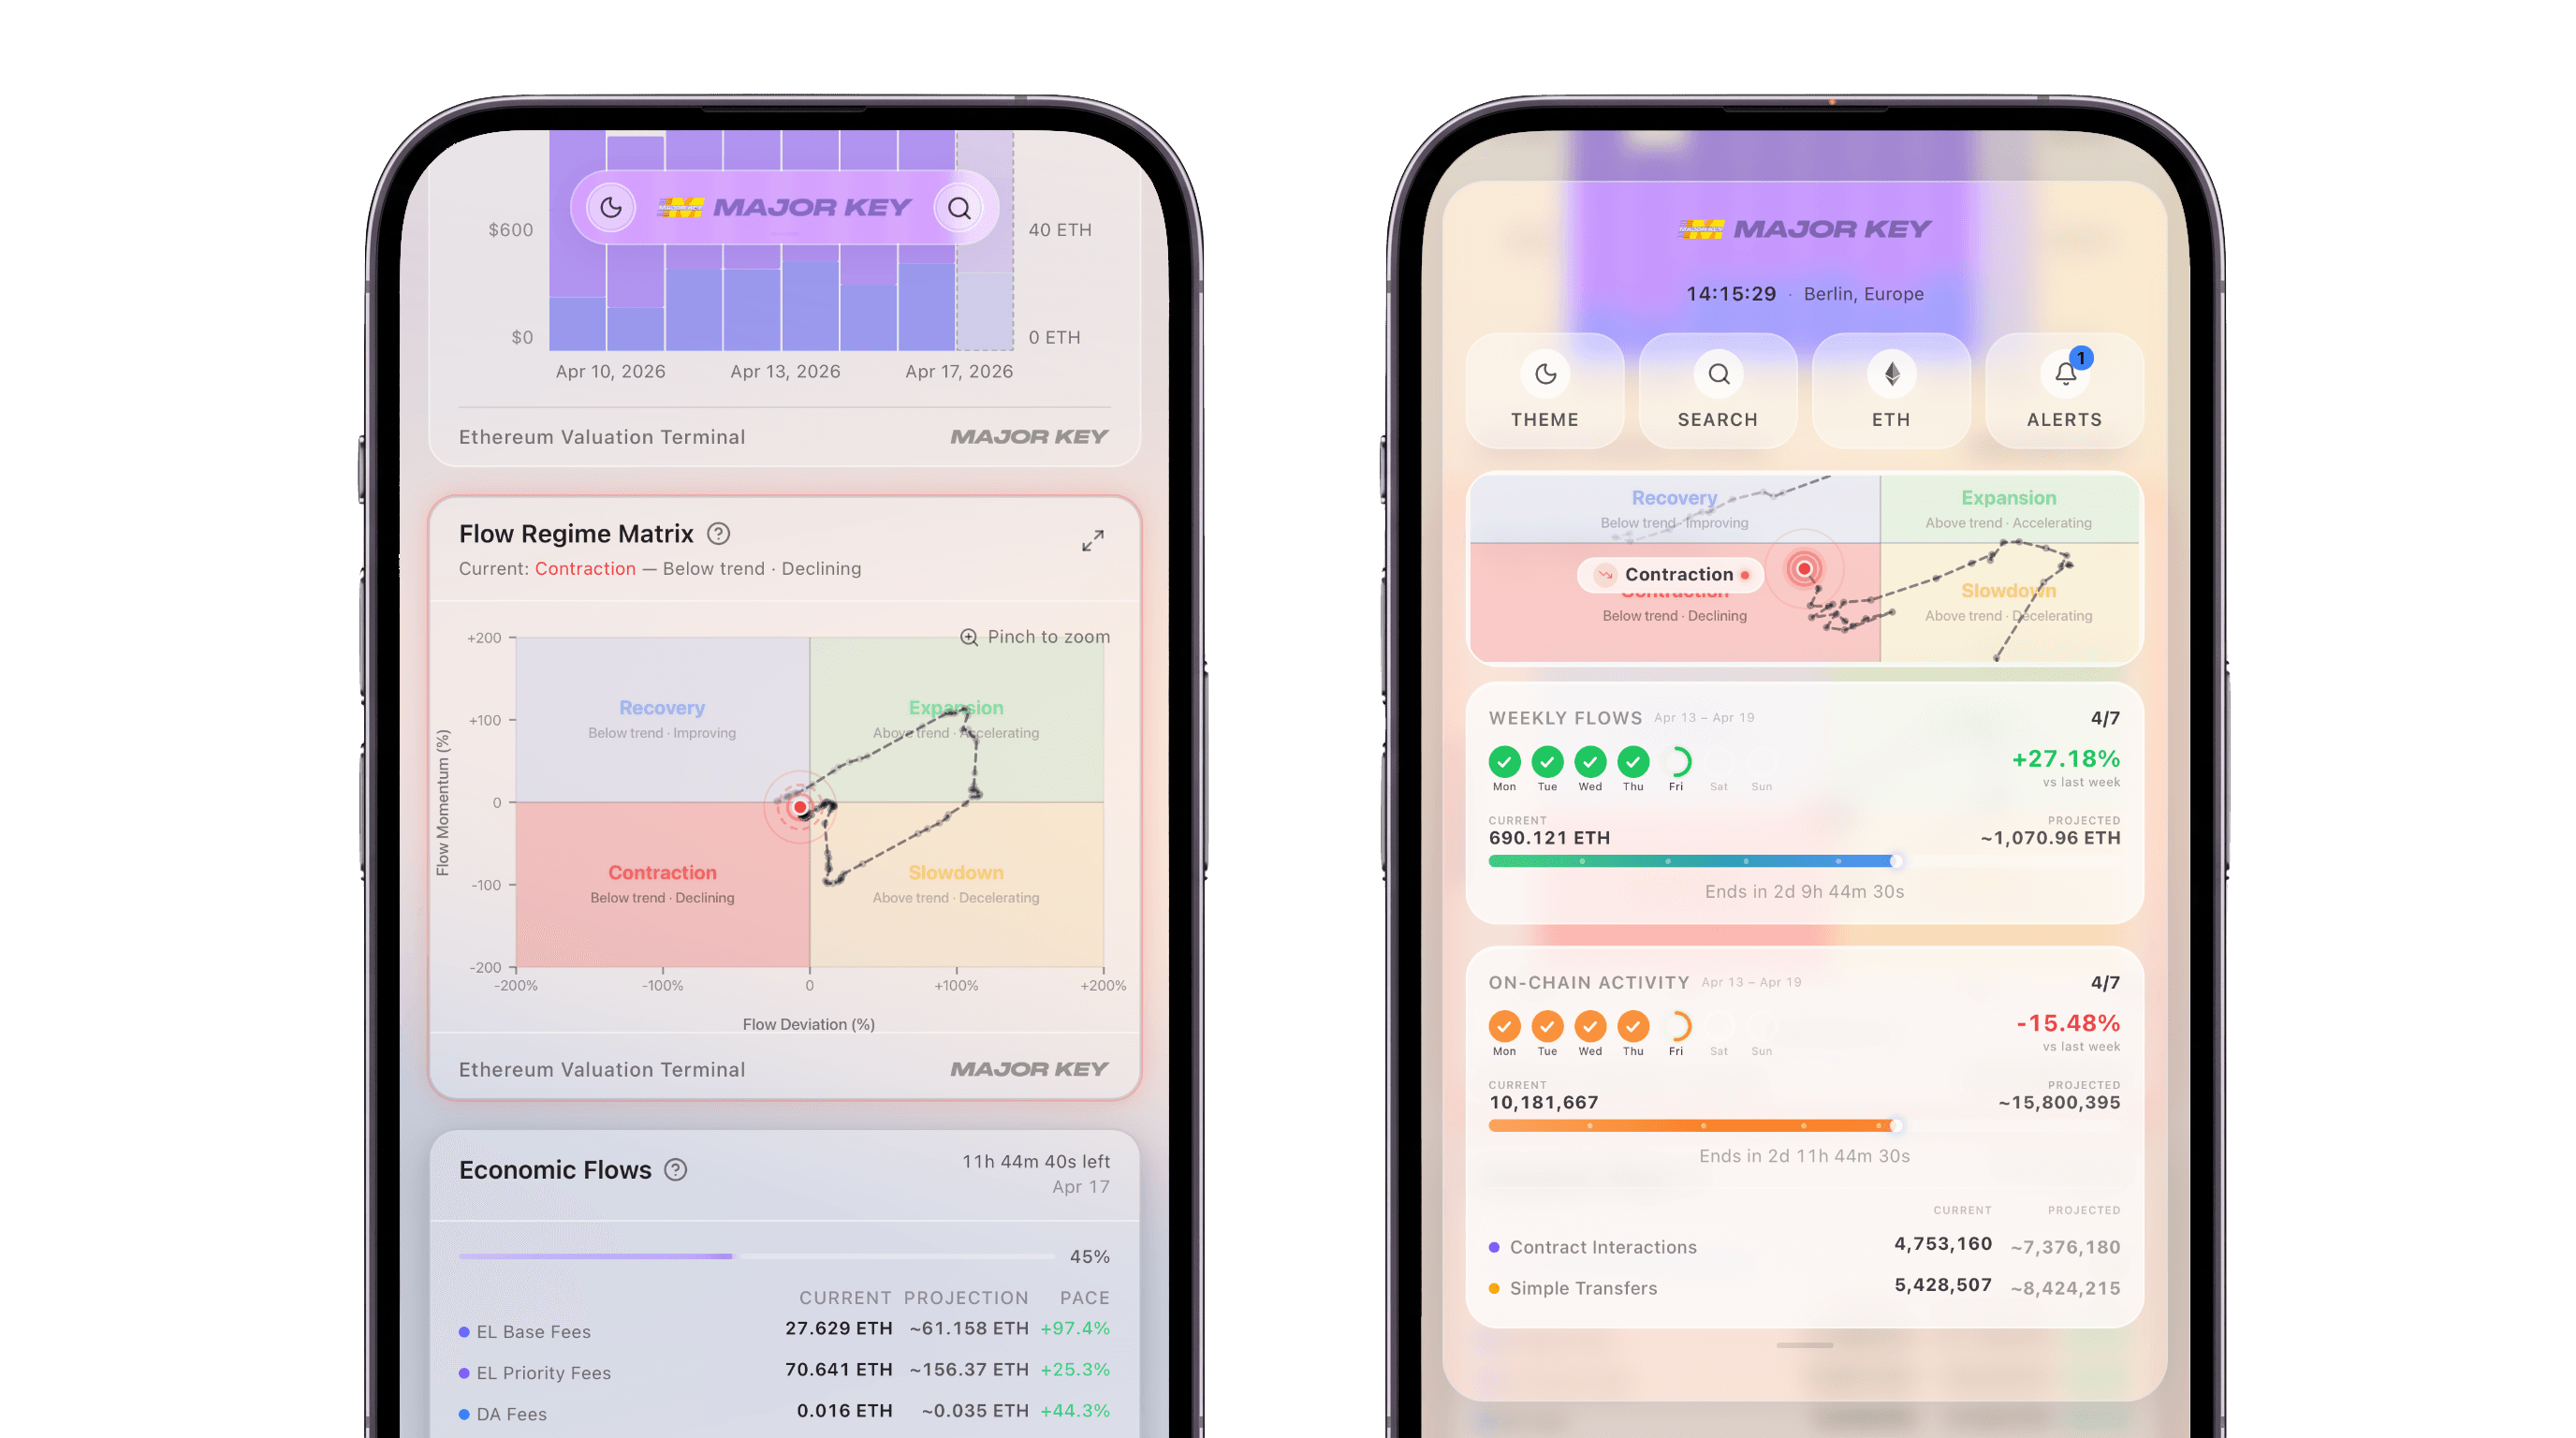
A live analytical platform that derives Ethereum's implied fair value from on-chain economic output. Built on a science-backed first-principles model, a scenario-based projection engine, and ten deep-dive sections — validated out-of-sample on 3.5 years of daily data since The Merge. Available on all devices such as Desktop, tablet, and mobile-native web-app. Designed for simplicity and ease of use.
$2,999/yr each
effectively $249/mo


Social proof
Portfolio managers, family offices, and independent researchers already use the terminal to shape real capital decisions. Here's what they have to say.

“Flow Intensity gave me a framework I can actually size positions around. Before this I was guessing off vibes and Twitter threads. Now I check the regime matrix every morning before I touch a single trade — it’s the first thing that actually made position sizing feel rational.”

Marcus Cole
DeFi Portfolio Manager · Self-directed

“The projection engine replaced our quarterly spreadsheet ritual. We used to cobble together fair value estimates from three different sources and none of them agreed. Now we have one model with documented methodology and live updates — that’s what we actually need before investing.”

Sofia Reyes
Digital Asset Strategist · Northmark Capital

“Regime detection backed by actual flow data. I’ve paid for institutional terminals that gave me less signal than this. The projection engine alone saved me weeks of spreadsheet work — I can model fee scenarios in minutes instead of building everything from scratch.”

Julian Venturi
Private Investor · Family Office

“I used to spend Sunday nights rebuilding fee dashboards in Dune just to prep for Monday. Now I open the terminal and everything is already there — real-time, structured, and actually denominated in ETH. It changed how I think about valuation entirely.”

Amara Okafor
Crypto Equity Analyst · Sable Ventures

“Clean enough to screenshot for my research notes, deep enough to actually inform a thesis. I’ve pulled more usable charts from the gas demand page in one session than I got from a month of building custom Dune dashboards. The deep-dive pages alone are worth the subscription.”

Noah Hartley
Independent Researcher · On-chain Analytics

“Out-of-sample R-squared that holds post-Dencun. That’s not marketing — that’s methodology. I’ve backtested enough models to know most break the moment regime shifts. This one didn’t. First time I’ve actually trusted a crypto valuation framework enough to allocate around it.”

Rafael Santos
Quantitative Analyst · Meridian Digital
The valuation engine
Live implied fair value. Regime detection. Premium and discount signals. All derived from the methodology — updated in real time, not just daily.
01
Open the terminal. Know what ETH is worth. Right now.
A single number derived from on-chain fee demand — not projected revenue, not token velocity, not discounted cash flows. The implied fair value updates through the day as fee pace changes, powered by a Binance WebSocket price feed and intraday partial-day smoothing that adjusts the 30-day Flow Intensity average in real time.
When only 14 hours of fees are in, the model extrapolates the day’s pace before folding it into the moving average. No waiting for the daily close. No manual refresh.

02
Expansion, slowdown, recovery, or contraction — at a glance.
A 2×2 quadrant chart mapping Flow Deviation (how far demand is from its baseline) against Flow Momentum (whether that deviation is accelerating or decelerating). Four regimes emerge: expansion, slowdown, recovery, contraction. A live dot tracks the current session. A trajectory path shows how the economy arrived here.
Expanded mode adds a synced timeline scrubber with an IFV mini-chart overlay — so you can replay the regime path while watching fair value and market price diverge in lockstep.

03
See where the bar is heading before the close.
Every in-progress bar — daily, weekly, or monthly — shows its running rate projection: what the final value would be if the current pace holds. The tooltip reveals a countdown timer to period end, with three columns: Current, Projection, and Pace for both fair value and market price.

04
Overvalued or undervalued. No ambiguity.
The area between implied fair value and market price is filled in real time — blue when fair value sits above spot (undervalued), red when below (overvalued). A ±5% threshold defines the signal boundary: beyond it, the model issues a categorical call. Within it, the assessment is “fair value range.”

The real-time running rate tells you
where ETH stands.
The projection engine
shows you where it's going.
See projections in action
Projection engine
Build time-bounded segments with individual EL and DA growth rates. Add external shocks, hypothetical project launches, and protocol upgrades. Tap any projected fair value point to reverse-engineer
the flows required to reach it.

Segments & scenarios
Split the future into time-bounded segments, each with its own Execution Layer and Data Availability growth rates. Run base, bull, and bear cases side by side. Save any scenario and compare it against your live workspace with a single tap.

Finally stop guessing where ETH is headed.
Build your custom scenario and let the model show you.
Try the full terminal
// Side-by-side
Each tool, audited on the questions ETH allocators actually ask. Where a check or cross would flatten useful nuance, the cell carries a short factual line instead.
Sources verified — Q2 / 2026
1 / 3 · Premium research firms
How premium research firms package thesis, governance, and ecosystem narrative for ETH allocators.
Swipe table sideways to compare all tools →
2 / 3 · On-chain analytics terminals
How analytics terminals turn live blockchain telemetry into wallet flows, exchange data, and on-chain ratios.
Swipe table sideways to compare all tools →
3 / 3 · Fundamentals & tokenomics data
How fundamentals aggregators standardise TVL, fees, revenue, and cross-chain comparables across ecosystems.
Swipe table sideways to compare all tools →
Every cell is judged on what each tool publishes about itself (pricing pages, product pages, public docs). No third-party reviews were used to score competitors.
Pricing
Most investors spend more on alpha groups, signal bots, and dashboard subscriptions that offer no underlying model — let alone a valuation framework validated out-of-sample on 3.5 years of on-chain data. One subscription replaces all of it. Every section, every chart, every projection. Here's what actually changes.
The math
A $500K ETH position where the terminal improves your entry or exit by 3% means $15,000 in better decisions — more than an entire year of access. At $100K, a 3% edge is still $3,000 — nearly 4x the monthly cost.
One well-timed rebalance. One avoided drawdown. One conviction hold when the market panics. Any one of these pays for the terminal many times over — and the model gives you the framework to make each call with evidence, not instinct.
The question is not whether the terminal is expensive. The question is how much you're leaving on the table without it.
$9,999/year
$9,999/year after first year
Monthly cancels anytime. Annual includes 30-day guarantee.

You don't need another dashboard.
You need a full framework.
The problem
Ethereum is the second-largest crypto asset in the world. Every major valuation framework produces a different answer — and most of them have already failed.
Revenue Yield
$677
Severely overvalued
CryptoQuant
P/S Ratio
$1,296
Overvalued
CryptoQuant
NVT Signal
$4,800
Slightly overvalued
CryptoQuant
Metcalfe (alt)
$9,484
Deeply undervalued
CryptoQuant
VanEck DCF
$22,000
90% revised in 12mo
VanEck, 2024
Etherealize
$740,000
Global macro target
Etherealize, 2025
You're allocating capital to an asset where the most credible frameworks in the entire industry disagree by a factor of one thousand. Or worse, even more.
This is not an edge case. This is the state
of Ethereum valuation today.
See how we solved it
// The methodology
ETH is driven by real economic demand across two protocol layers. We turned that demand into an
implied fair value. From ETH to USD.

Three steps. On-chain data goes in.
Implied fair value comes out.
01
FI = Fees ÷ Supply
GDP per capita, but for a blockchain.
Total daily fees divided by circulating ETH supply. Measures how much economic demand the network captures per unit of the token, denominated entirely in native units.
02
FD = ln( smoothed FI ÷ Reference Rate )
Above trend, or below it.
Compares current Flow Intensity to its 90-day trailing median (the Reference Rate). Positive means demand is running above baseline. Negative, below it.
03
Price × exp( FD )
The answer.
Market price scaled by the Flow Deviation. When demand runs above trend, fair value sits above spot. No growth-rate assumptions. No discount-rate calibrations.
22.8%
R-squared
76.4%
Directional accuracy
1,280
Days of data
100%
ETH-denominated
Zero
Assumptions required
From “Token valuation without firms”
— — Dünnes & Felsenstein-Eckberg — MAJOR KEY Research & Accenture
Research-backed. Out-of-sample validated.
A valuation framework native to Ethereum.
Crafted Experience
Every interaction questioned. Every pixel intentional. The kind of craft you feel before you notice — in every transition, every tooltip, every glanceable detail.

Always-On Context
Regime status, search, and notifications — all from one persistent element at the top of every page. Expand to reveal the Flow Regime Matrix, CMD+K search across every chart and scenario, data freshness indicators, or denomination toggles. The entire terminal is one keypress away.

Glanceable by Design
QuickPeek on mobile. Synced crosshairs across every pane. Running-rate tooltips in real time. Tap or hover — it reveals itself.

Two Themes
Light and dark-glass modes, built from scratch. Every chart, every surface, every gradient.

CMD+K
One keystroke to any chart, scenario, or metric. Fuzzy matching across the entire terminal.

Mobile PWA
Add to home screen. Standalone mode. Native gestures. The full terminal — no browser chrome.
Experience the terminal
Questions
How the model works, what's included, how billing works, and which devices are supported. If it's not answered here, reach out and we'll respond directly.
About the terminal
About the model
Pricing and access
Technical