


TL;DR: Executive Summary
Ethereum has a price but no agreed-upon fundamental value — the market never settled on a method, so every model points somewhere different. This framework starts from what Ethereum actually earns (fees), measures it per unit of supply, and derives a live implied fair value. Out-of-sample, the signal called the next 45 days' direction right 76.4% of the time vs 35.5% for a naive benchmark.
- The real problem: Ethereum has a price but no agreed-upon fundamental value. There's no shared method — so every model points somewhere different.
- Why: They borrow frameworks built for something else — equities, Bitcoin, network graphs — and force Ethereum to fit.
- The insight: Ethereum earns. It generates real economic flows — the fees paid to use it. Measure those flows per unit of supply, and you finally have a fundamental.
- The result: A live, implied fair value for ETH, derived from its own on-chain economy. Out-of-sample, the signal called the next 45 days' direction right 76.4% of the time, versus 35.5% for a naive benchmark.
- The product: The Ethereum Valuation Terminal — the framework, running live, updated every block.
You own Ethereum, or you're thinking about it. So answer one question — and notice how it feels when you try.
What is it actually worth?
Not the price. The price tells you what someone will pay this afternoon. We're asking something harder: what is the fundamental value of the asset you're holding? For a stock, you'd have an answer — earnings, cash flow, a multiple you could defend. For Ethereum, most people go quiet. They check the chart instead. And checking the chart is not the same as knowing.
That quiet is the whole problem. You can't size a position you can't value. You can't tell a top from a dip. You can't even answer the simplest version of it — is ETH still worth holding? — without an anchor to hold it against. You're left reacting to price instead of anchoring to worth, and somewhere you've made peace with that, because everyone else has too.
Here's the part worth sitting with: it isn't your fault. The tools the market hands you don't actually agree on an answer. We decided that was a problem worth solving properly — so we did the research, wrote the paper, and built the product. This is the story of both.
Where should ETH trade right now?
See the live implied fair value — open to everyone.
Ethereum has a price. It has never had an anchor.
Every asset that markets take seriously has a fundamental anchor — something underneath the price that tells you whether the price is reasonable. Stocks have earnings. Bonds have yield. Real estate has rent. The number moves, but you always know what you're measuring against.
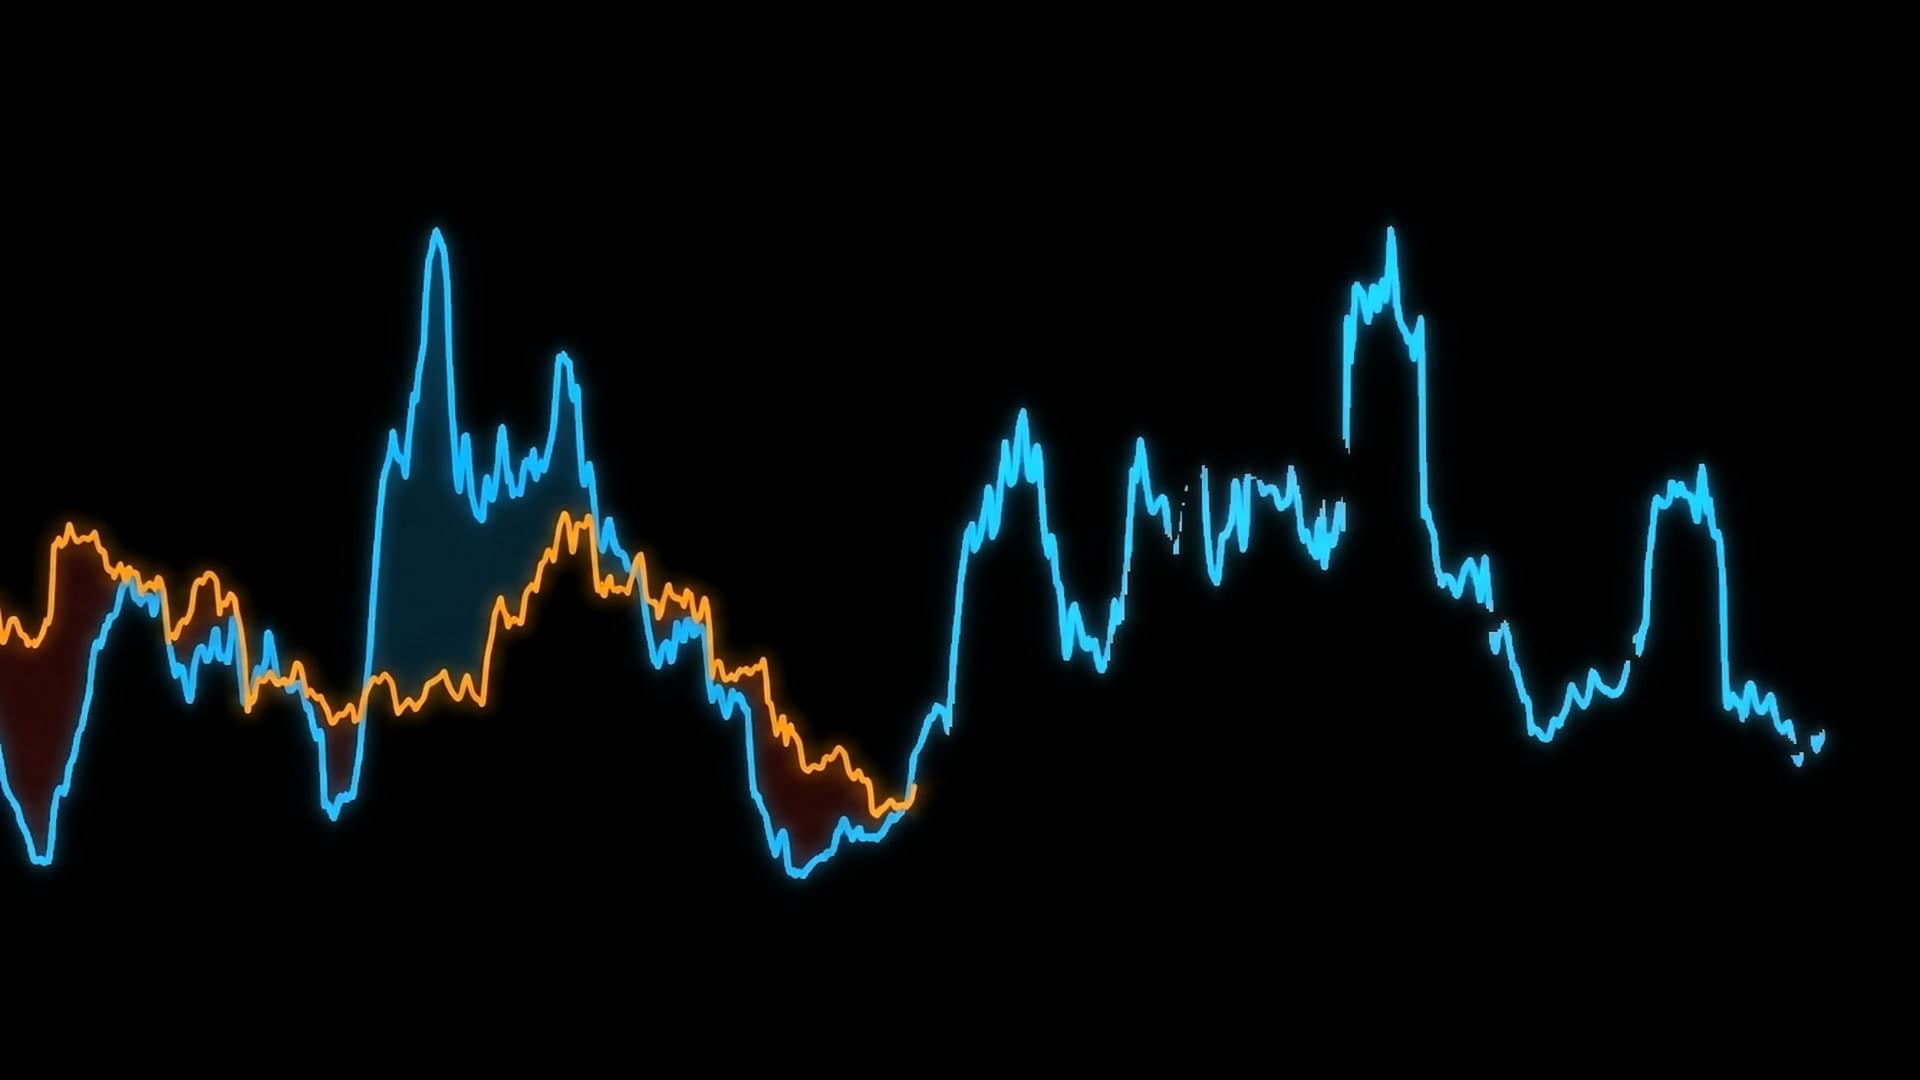
Ethereum has never had that anchor. Not because it produces nothing — it produces a great deal — but because nobody agreed on how to measure it. So the conversation defaulted to narrative. Ultrasound money. World computer. Triple-point asset. Each story implies a wildly different value, and none of them is something you can put a number on and defend in a meeting.
You can watch this play out whenever someone tries. Ask the popular models what ETH is worth and you don't get a consensus with some noise around it — you get answers that range from a few hundred dollars to nearly ten thousand, at the very same moment in time. The model rated most reliable often says overvalued while the rest say deeply undervalued. When the tools disagree by an order of magnitude, that's not a measurement problem. That's the absence of a method.
It gets worse with time. A respected research desk published a fair value north of $8,000 for ETH in late 2023, then cut it to around $1,500 within a year — because one protocol upgrade changed the inputs their model depended on. A framework that swings 80% on a single upgrade was never measuring anything durable.
Why every borrowed framework breaks
The reason is simpler than it looks: each of these models was built to value something other than Ethereum, then pointed at it anyway.
- Discounted cash flow treats ETH like a company paying dividends. It isn't. Nudge the growth or discount rate slightly and the answer moves by multiples.
- Price-to-Sales and Price-to-Fees give you a ratio, not a value. To turn a ratio into a price you must pick the "right" multiple — which is the question you started with.
- Metcalfe's law says value scales with users. But "users" means addresses, and addresses are free to create. The exponent you choose decides the answer.
- Stock-to-Flow was built for Bitcoin's fixed supply. Ethereum's issuance is set by policy and changes. The core assumption simply doesn't hold.
- NVT and velocity models lean on transaction volume polluted by exchange plumbing and stablecoin flows — and fragmented further by Layer 2s.
Serious people have said the quiet part out loud. Vitalik Buterin called models that "give people a false sense of certainty" deserving of "all the mockery they get." John Pfeffer, formerly of KKR, argued it's "difficult to justify ETH as an instrument through which an investor can expect to proportionately benefit from value creation." The gap isn't a fringe complaint. It's the consensus among the people who've looked hardest.
Why DCF doesn’t work for ETH — and what does.
Our methodology rebuilds Ethereum valuation from first principles: supply mechanics, fee flows, and a single signal you can test. Read the paper, walk the method, then see it priced live in the Terminal.

Start from what Ethereum actually does
Here's the shift that changes everything. Stop asking which framework to borrow. Ask what actually drives Ethereum's value — what the network actually produces.
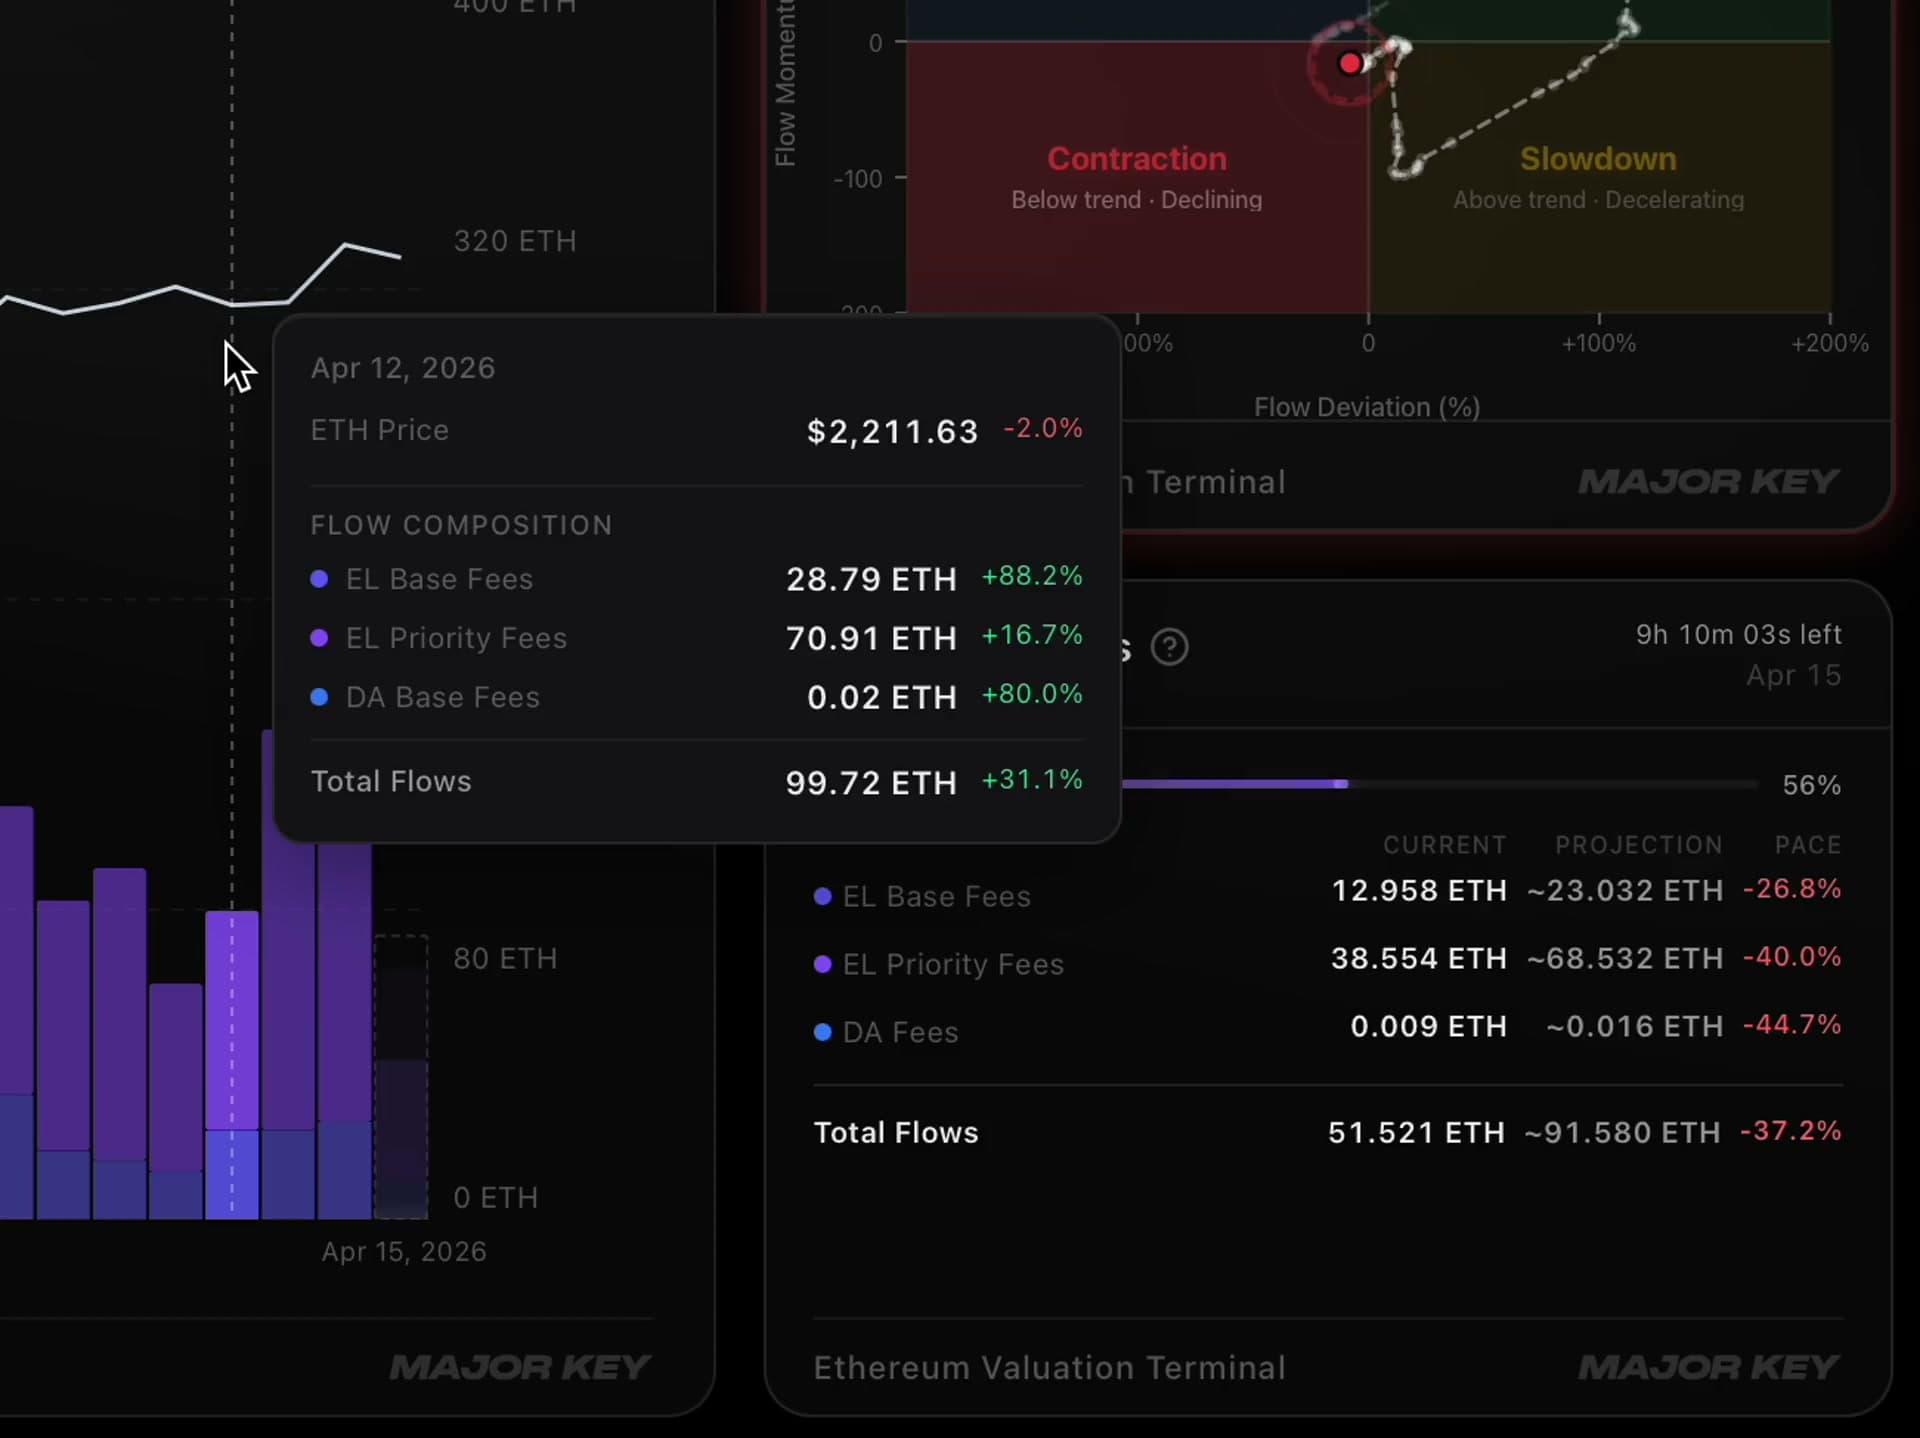
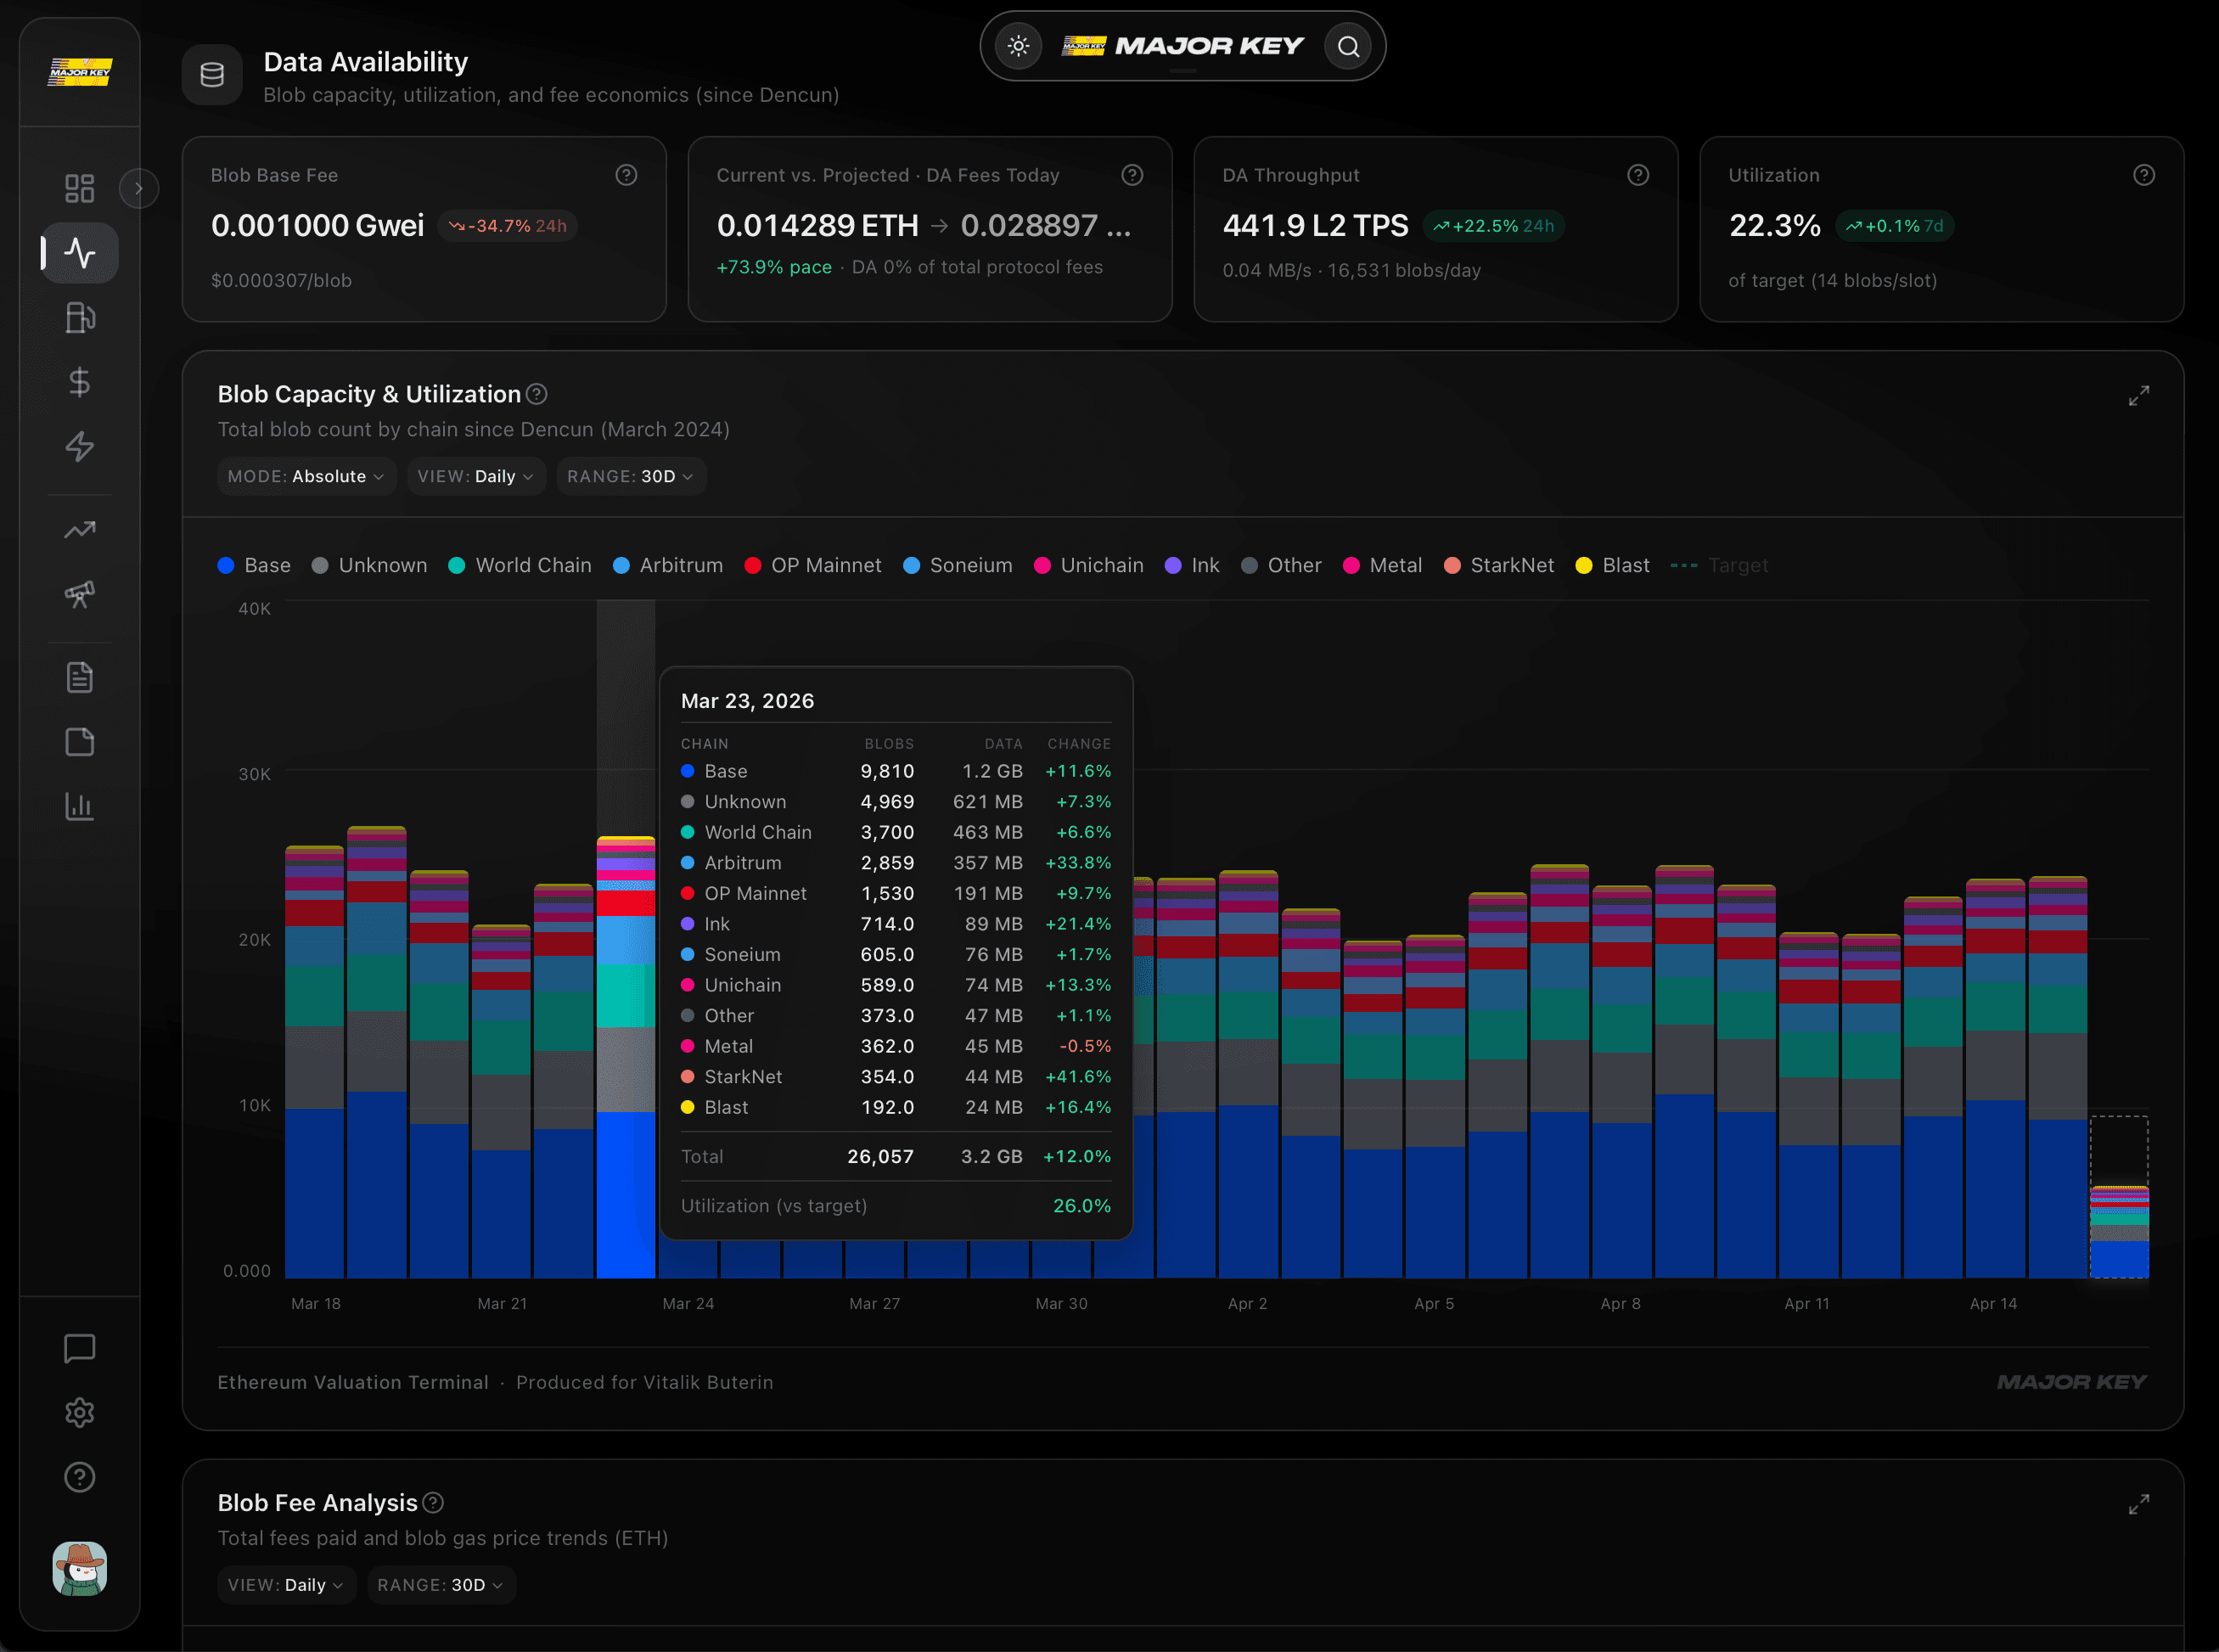
The answer is fees. Every transaction, every swap, every stablecoin transfer, every smart-contract call pays a fee to use the network. Together these are the flows — the real economic output of Ethereum's on-chain economy. They're paid in ETH. They're recorded on-chain. They need no assumptions to observe. They're simply there, block after block, whether or not anyone is looking.
That's the anchor. It was there the whole time. It just needed to be measured correctly.
From that one anchor, the framework does three things — and only three. No forecasts of the future. No assumptions about issuance. No borrowed multiples. Each step builds on the last: measure the economy, judge it against its own history, then turn that into a price.
Measure Flow Intensity
Total daily fees ÷ circulating supply, smoothed over 30 days.
Flow Intensity (FI)
The network’s total daily fees divided by the circulating supply of ETH — the economic output per unit of supply. Think of it as GDP per capita for a blockchain. Because it’s measured entirely in ETH, it sidesteps the fiat-denominated circularity that traps most crypto valuation.
Compare it to its own history
How far Flow Intensity sits above or below its own rolling baseline.
Flow Deviation (FD)
The natural log of smoothed Flow Intensity divided by its rolling historical median (the Reference Rate). Positive means the economy is running hot relative to its own normal; negative means cold. This is the signal that does the predictive work — no macro inputs, no borrowed multiples.
Derive an implied fair value
Re-anchor market price by how hot or cold the economy is running.
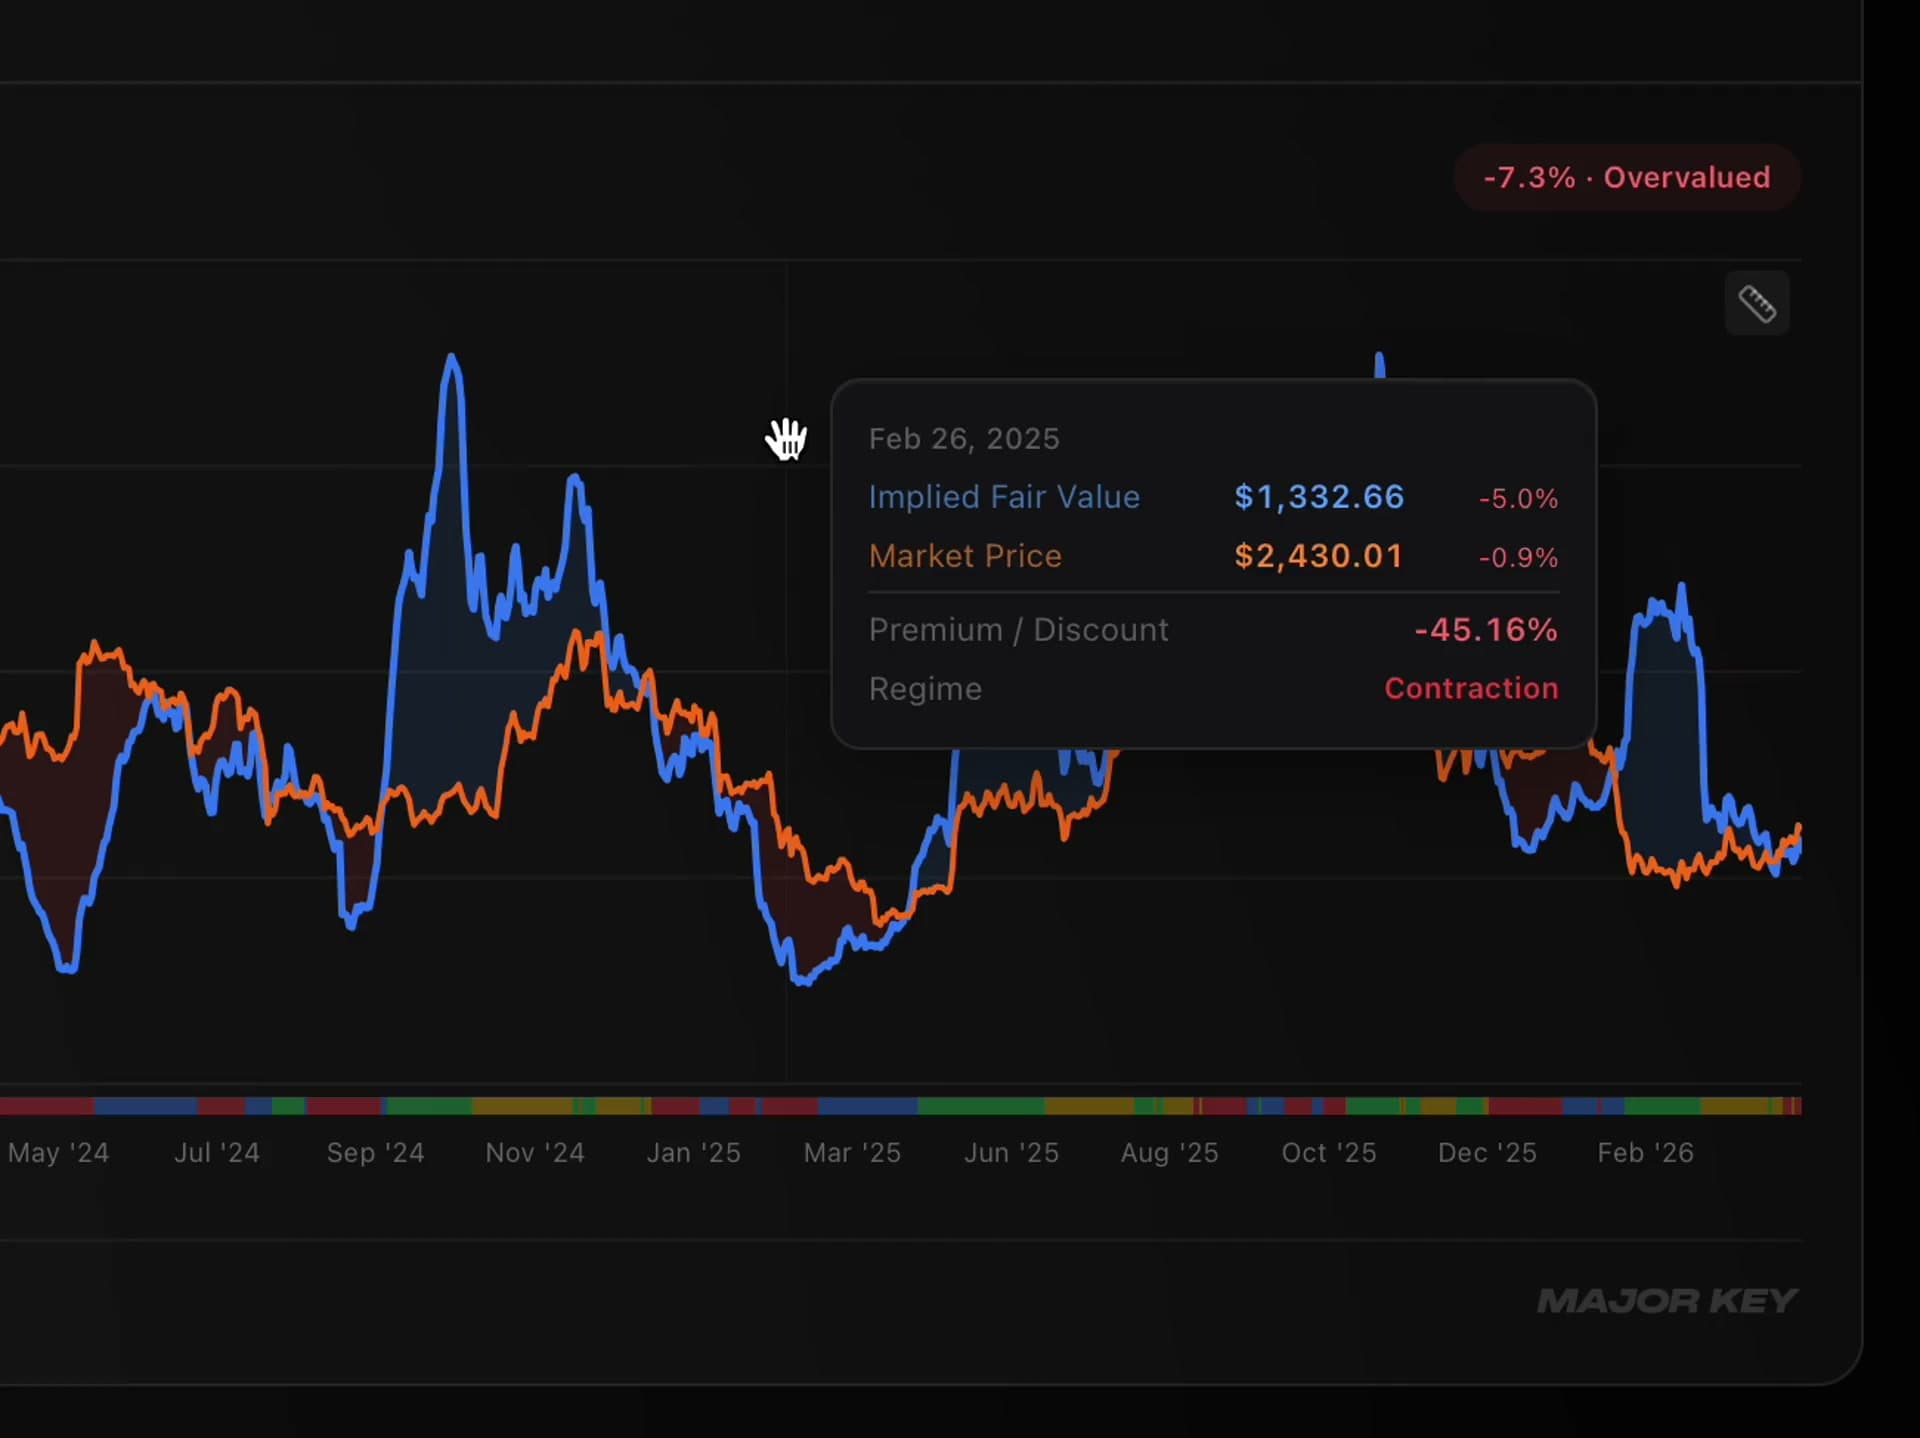
Implied Fair Value (IFV)
Price × exp(Flow Deviation). When demand runs above baseline, fair value sits above price; below baseline, below it. The output is one live number — what ETH is worth given what its economy is actually doing, right now.
Three steps, no borrowed assumptions, one live number — what ETH is worth given what its economy is actually doing, right now rather than last quarter.
The part that matters: does it hold up?
A model that fits the past is easy to build and worthless to trust. The only test that counts is whether it holds on data it has never seen. So we ran it the hard way.
In an expanding-window out-of-sample test — the model trained only on past data, then judged on future data it had never touched — the Flow Deviation signal called the direction of ETH's next 45-day return correctly 76.4% of the time. A naive "always long" benchmark over the same window was right just 35.5% of the time. That's a 41 percentage-point lift, out-of-sample.
0.0%
Out-of-sample directional accuracy
Next 45-day direction, post-Dencun
0.0%
Naive "always long" benchmark
Same window, no signal
+0 pts
Lift over the benchmark
76.4% vs 35.5%, out-of-sample
0.0%
Out-of-sample R²
Variance explained on unseen data
For context, the strongest single fundamental signals in equity markets explain just 1–5% of future returns. In-sample R² peaks at 22.8%.
Put plainly: at the 45-day horizon, the signal told you whether ETH was headed up or down — and it was right roughly three times out of four on data it had never seen. A coin flip is one in two. The reflexive "just stay long" habit was right barely one in three over the same stretch. Calling direction correctly three-quarters of the time, from a single on-chain number, is the kind of edge that's rare even in mature equity markets — where the strongest fundamental signals explain just 1–5% of future returns.
The full result holds across every horizon we tested — in-sample and, more importantly, out-of-sample, where the model is judged only on data it was never trained on.
In-sample predictability (post-Dencun, N = 645)
| Horizon | Coefficient | t-stat | p-value | R² |
|---|---|---|---|---|
| 10 days | 0.080 | 2.65 | 0.008 | 5.1% |
| 20 days | 0.171 | 3.22 | 0.001 | 10.0% |
| 30 days | 0.282 | 3.87 | <0.001 | 15.8% |
| 45 days | 0.456 | 3.84 | <0.001 | 22.8% |
| 60 days | 0.459 | 2.94 | 0.003 | 17.1% |
Expanding-window out-of-sample
| Horizon | OOS R² | Clark-West t | Dir. accuracy |
|---|---|---|---|
| 30 days | 9.0% | 7.73 | 67.1% |
| 45 days | 14.4% | 9.16 | 76.4% |
| 60 days | 10.3% | 9.63 | 73.1% |
A naive “always long” benchmark achieves 35.5% directional accuracy at 45 days. The model’s 76.4% is a 41 percentage-point improvement.
A single on-chain metric explaining roughly 14% of returns out-of-sample — no macro inputs, no curve-fitting — is unusually strong. The signal also survives a full battery of controls: macro factors, Bitcoin, momentum, volatility, and network activity. It holds.
One honest caveat, because it matters: this predictability only emerges after the Dencun upgrade of March 2024, which split Ethereum's fee market into distinct channels and made the demand signal cleanly observable. We don't bury that. It's stated plainly in the paper.
Proof you can audit
You don't have to take any of this on faith. The method is written up in a working paper — "Token valuation without firms: Demand-side flows and return predictability on Ethereum" — by Lucas Dünnes (MAJOR KEY Research) and Dr. Jens Felsenstein-Eckberg (Accenture), both trained at the University of Regensburg. It is currently under review at Management Science, one of the leading journals in finance and economics, and published openly so anyone can check the formulas, the tests, and the data. We'd rather be judged on the work than ask you to trust the conclusion.
You don’t have to take our word for it.
The full method is written up in a working paper under review at Management Science, and published openly so anyone can read the formulas, the tests, and the data — from Flow Intensity, to Flow Deviation, to the implied fair value it derives.


Publishing it openly is a deliberate choice. A valuation method you can't inspect is just another black box asking for your trust — and ETH already has enough of those. Every formula, every test, and the full data are on the page, which means you, or your most skeptical colleague, can try to break it. That's the standard we'd want as readers, so it's the one we held ourselves to. The conclusion is only worth as much as the work it rests on, and here the work is in the open.
Prefer to walk it step by step? See the full method on the methodology page, or put it side by side with DCF, Metcalfe, Stock-to-Flow and the rest on the methods breakdown.
From a paper to a live terminal
A fair value you calculate once is useful once. A fair value that updates with the network is useful every day. So we built the framework into a product: the Ethereum Valuation Terminal. Here's a two-minute walkthrough of the model, the framework, and what implied fair value looks like when it's running live.
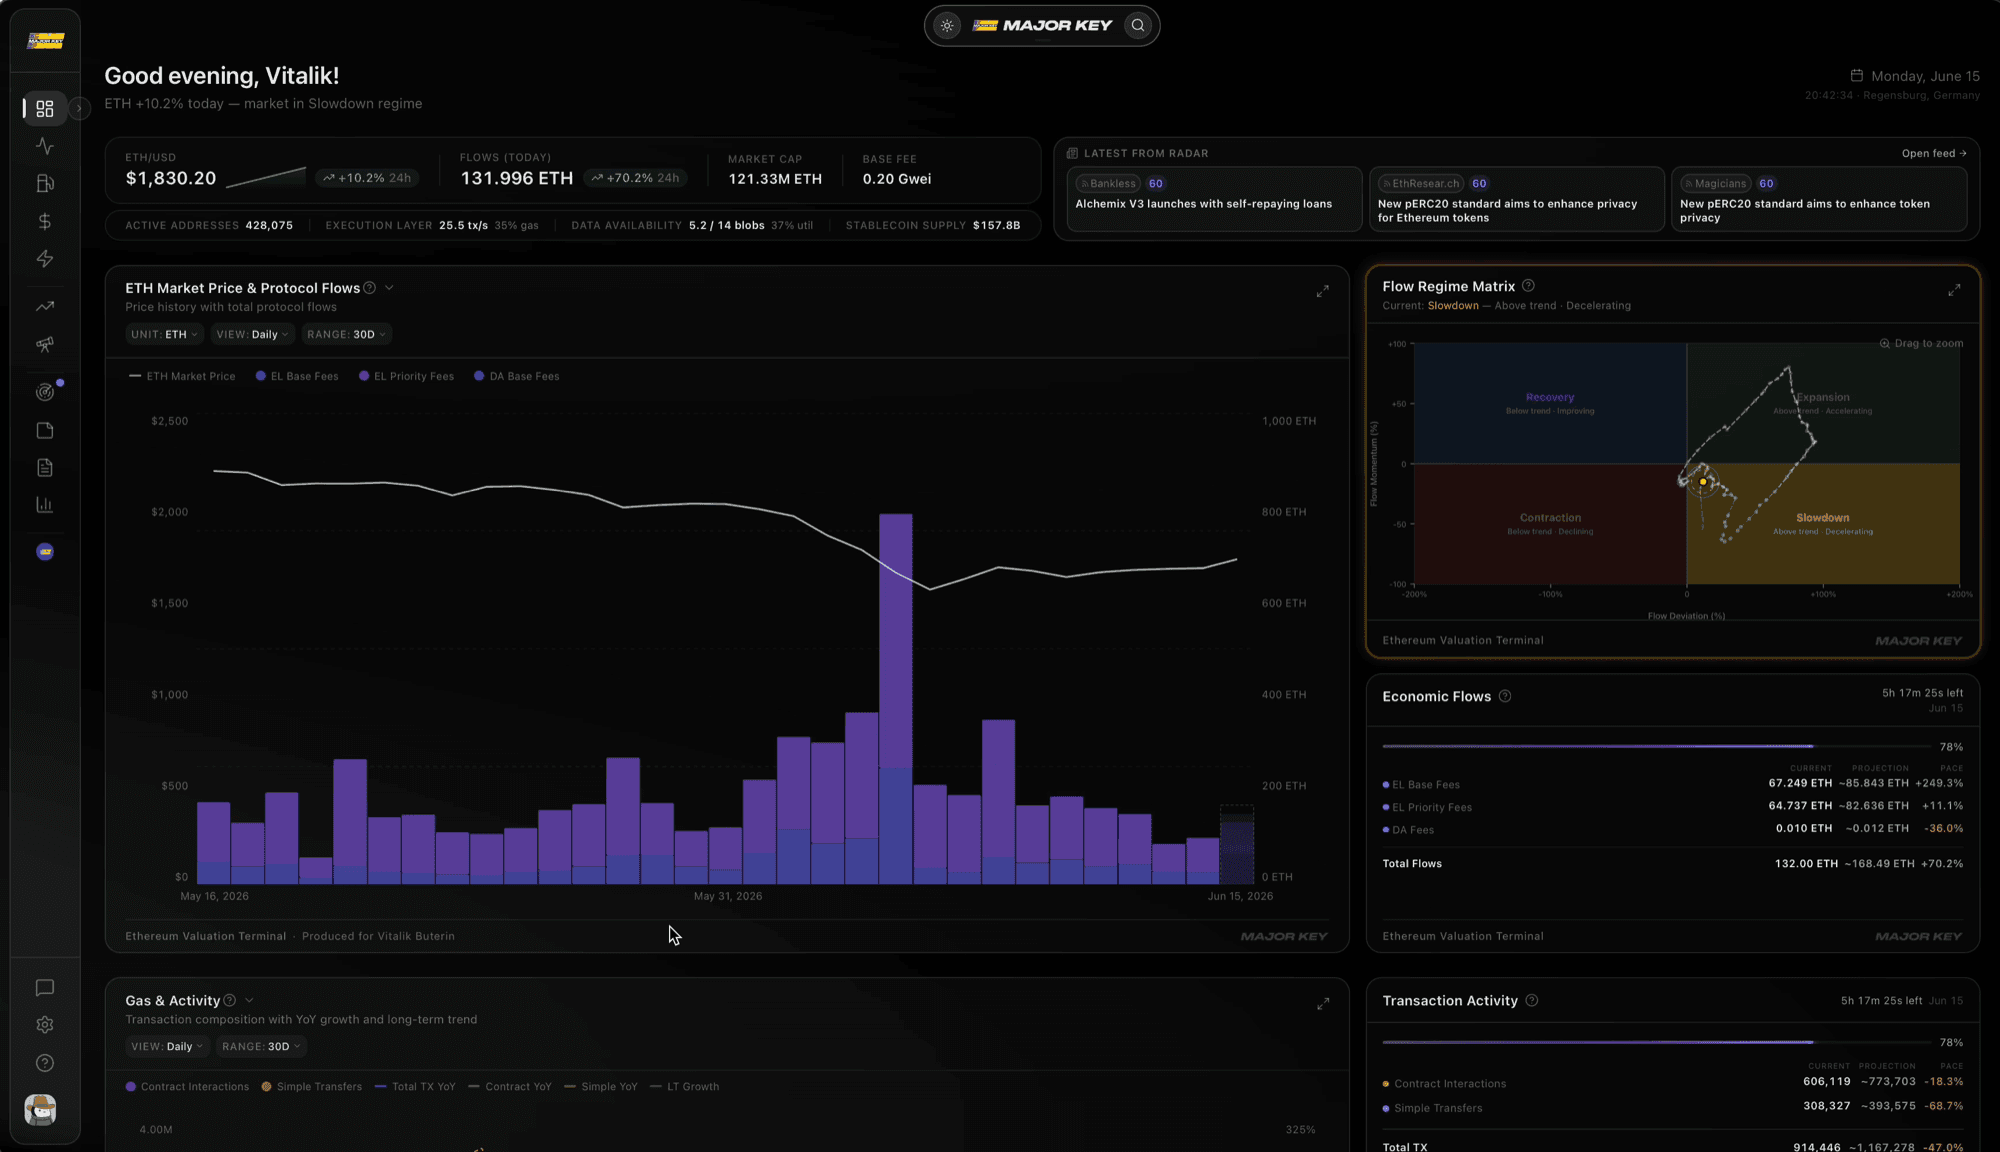
Why "live" matters: Ethereum's economy doesn't pause between quarterly reports. Fees move block by block, demand shifts with every cycle of activity, and a fair value you computed last month is already stale. The terminal recomputes the entire chain — Flow Intensity, Flow Deviation, implied fair value — continuously, classifies which regime the economy is in, and flags whether ETH is trading at a premium or a discount to what its own output justifies. You stop re-deriving a model every time you want an opinion. You open one screen and read the current answer.
That's the difference between owning a spreadsheet and owning an instrument. What used to take a desk of analysts and a wall of formulas now runs itself — and it doesn't just print a number. It shows you the why behind it, the regime you're standing in, and where the model expects price to travel under your own assumptions. Concretely, here's what it puts to rest:
One ETH-native fair value
DCF, Metcalfe, and Stock-to-Flow retire — replaced by a single number derived from Ethereum’s own economy.
A model that runs itself
No rebuilding formulas. It recomputes the entire chain as the on-chain economy moves, block by block.
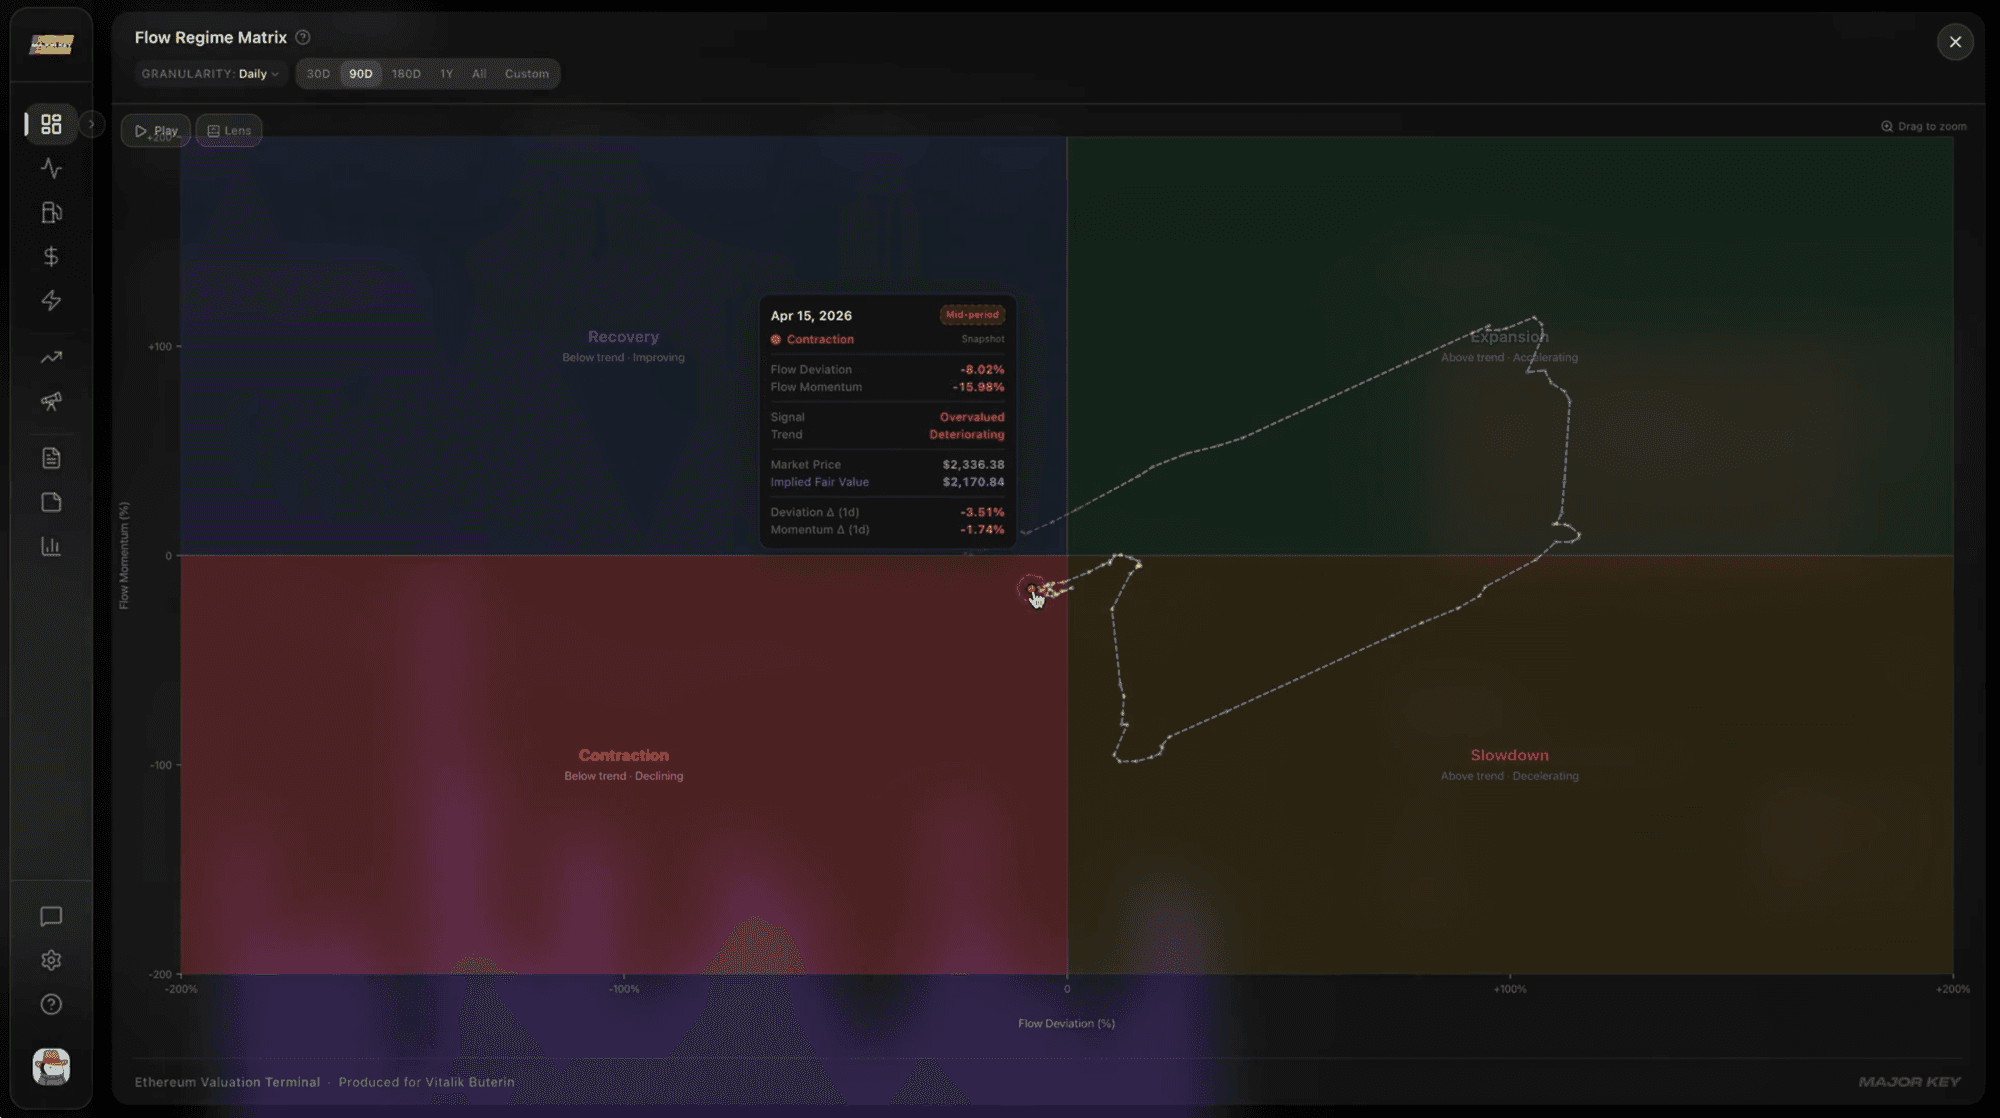
The regime, classified for you
Expansion, Slowdown, Contraction, or Recovery — you always know which state the economy is in.
Scenarios you can stress-test
Project implied fair value at 1, 2, and 5 years under your own growth and shock assumptions.
Each of those used to be a separate chore — a model to rebuild, a spreadsheet to babysit, a regime to guess at, a target to revise by hand. The terminal collapses them into one surface that maintains itself. The work that justified a research desk now happens in the background, and what reaches you is the conclusion, not the labor behind it.
That changes what the question costs you. "What is ETH worth?" stops being a half-day of assumptions and caveats and becomes something you can answer in the time it takes to open a tab. You get the number, the regime it sits in, and the premium or discount to fair value — enough to size a position, sanity-check a thesis, or simply sleep on a clearer picture of what you own.
And it's not a static report. Every section below is interactive, updated as the chain moves, and built to be read in minutes rather than reconstructed from scratch.
The Ethereum Valuation Terminal.
Live implied fair value
Updated every block, with a premium/discount read against market price.
Flow-regime detection
Expansion, Slowdown, Recovery, or Contraction — always know the state.
Projection engine
Model 1, 2, and 5-year scenarios with your own growth rates and shocks.
Chartbook
A multi-pane, TradingView-style builder for the metrics that matter.
Daily reports + Keystone
An AI assistant that turns the day’s on-chain economy into a two-minute brief.
What this is — and what it isn't
This is a research framework, not a trading signal, and not financial advice. It won't tell you what to buy tomorrow, and it doesn't pretend to. What it gives you is something the market has never had: a falsifiable, on-chain, ETH-native answer to the only question that was ever worth asking — what is Ethereum actually worth? — and the conviction that comes with finally being able to answer it.
In practice, that means you stop arguing with a chart and start reading a number. You can see when the on-chain economy is running hot relative to its own history and when it's running cold. You can size a position against a fundamental instead of a feeling. And when someone quotes a model at you, you can set it next to the others and see exactly why they disagree — laid out side by side on the methods comparison.
It's built for the people who were never satisfied with "trust the narrative" — allocators sizing real exposure, analysts who need a number they can defend, and holders who simply want to know what they own. For the first time, Ethereum's fair value is open to everyone, not locked inside one desk's spreadsheet.
See it live
The framework, running in real time, is the Ethereum Valuation Terminal — the same screen, in your pocket or on your desk, recomputing as the chain moves. This is what it looks like to stop re-deriving a model every time you want an opinion, and simply read the current one.

The terminal, live in your hand.
Implied fair value, flow regime, and premium/discount — recomputed every block. Open one screen and read the current answer.
Monthly
$799/mo
$999 standard
Annual
$8,999/yr
$9,999 standard
30-day money-back guarantee. If it doesn’t change how you see your position, you don’t pay.
Want to start with the science instead? Read the working paper and the methodology first. Both are free — and together they are the entire argument. And if you simply want the number, Ethereum's live fair value is open to everyone.
Frequently asked questions
Disclaimer
This article and the Ethereum Valuation Terminal are research tools, not financial advice. Nothing here is a recommendation to buy or sell any asset. Implied fair value is a model output based on on-chain economic data and does not predict price. Do your own research.
Disclaimer
This content is for informational and educational purposes only and does not constitute financial, investment, legal, or tax advice. Nothing published by MAJOR KEY Capital should be considered a recommendation to buy, sell, or hold any investment or digital asset. Past performance is not indicative of future results. All investments involve risk, including the potential loss of principal. You should conduct your own research and consult with qualified professionals before making any financial decisions. MAJOR KEY Capital is not responsible for any losses incurred from acting on information presented in this article.