 01
01// flow intensity
Measure the demand
FI = Fees ÷ Supply
Every fee the network earns in a day, divided by all the ETH in existence. GDP per capita for a blockchain — what each token actually produces.
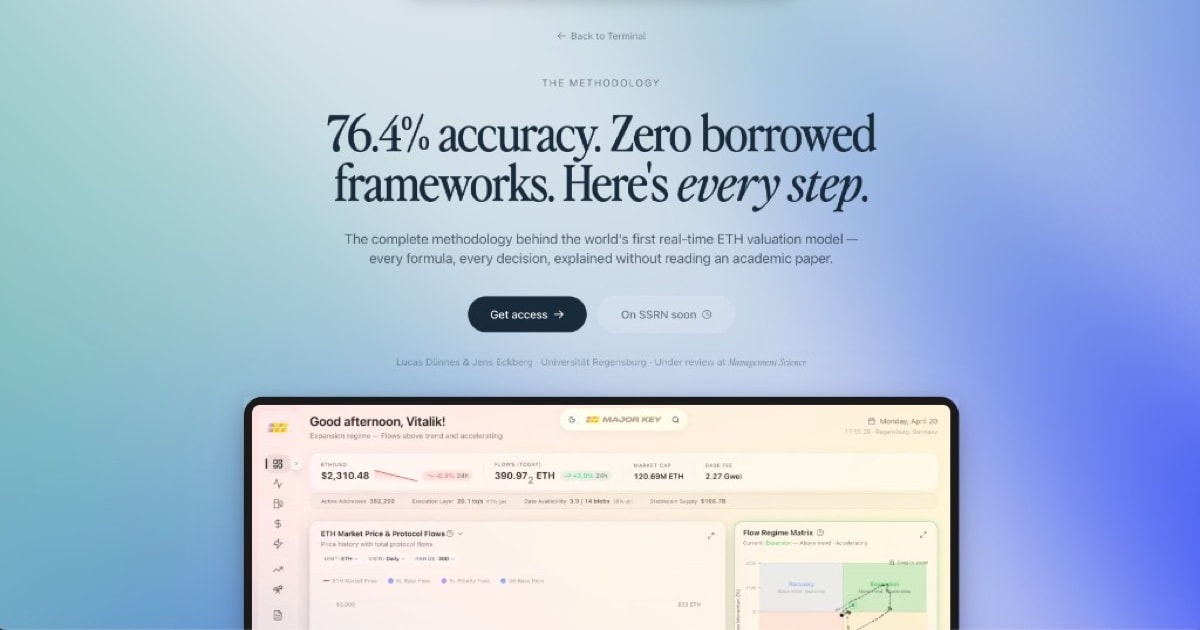
// the working paper
The working paper behind it — a model that called Ethereum's next move right, for months, on data it had never seen. The era of guesswork is over.
Lucas Dünnes & Dr. Jens Felsenstein-Eckberg · MAJOR KEY Research · Accenture · under review at Management Science
New to the thesis? Start with the full story.
// the headline result
We didn't fit a curve and admire it. We held data back, ran the model forward, and measured what it got right on a future it had never seen — then checked it against a benchmark that simply bets long every day.
76.4%
Out-of-sample directional accuracy
Called the next 45-day direction right — vs 35.5% for a naive "always long" benchmark (+40.9 pp).
14.4%
Out-of-sample R²
Variance explained on data the model never saw (Clark–West t = 9.16).
22.8%
In-sample R² at 45 days
Peak explanatory power in-sample — labeled in-sample, not the OOS figure above.
Read that the way a trader would. At the 45-day horizon, a single on-chain number told you whether ETH was headed up or down — and it was right roughly three times in four, on data the model was never trained on. A coin flip is one in two. The reflexive “just stay long” habit was right barely one in three over the same stretch.
That gap is the part worth sitting with. Calling direction correctly three-quarters of the time, from one number, is an edge that's rare even in mature equity markets — where the strongest fundamental signals explain just 1–5% of future returns. This one explains roughly 14% out-of-sample, with no macro inputs and no curve-fitting. The bars aren't a backtest we polished; they're what the model did on a future it had never seen.
// the science, on film
A short film walks through the method end to end — how a fee becomes Flow Intensity, how Flow Intensity becomes a testable signal, and why that signal predicts returns the borrowed models miss. It releases alongside the paper on launch day.
The explainer film releases on launch day.
The statistics behind the model, in plain language — start to finish.
Some proofs are easier to trust once you've watched someone build them. The paper above is the rigorous version — every formula, every test, every caveat, written for reviewers. The film is the legible one: the same logic drawn out in plain language, so the result stops being a number you take on faith and becomes one you can follow from first principle to conclusion.
You won't need a statistics background to keep up. The aim is simple — that by the end, you can look at the bars at the top of this page and know exactly what they mean, why out-of-sample is the only test that counts, and where the edge actually comes from.
// what it measures
No earnings to forecast. No borrowed stock-market math. Three moves on the network's own activity — and each one is a number you can check for yourself.
01// flow intensity
FI = Fees ÷ Supply
Every fee the network earns in a day, divided by all the ETH in existence. GDP per capita for a blockchain — what each token actually produces.
 02
02// flow deviation
FD = ln(FI ÷ reference rate)
How far that output runs above or below its own rolling baseline. Positive, the economy is running hot; negative, it is cooling off.
 03
03// implied fair value
Fair value = Price × exp(FD)
Scale today’s price by that gap and you get the number the model defends — tracked against the market, recomputed every day.
// why it holds
Notice what isn't here. No discounted cash flows, because Ethereum isn't a company paying dividends. No price-to-fees multiple you'd still have to guess at. No address-count curve to fit. Every borrowed framework smuggles in an assumption — a growth rate, a multiple, an exponent — and that assumption is where the answer quietly comes from. This model has no assumpations.
What it has instead is an anchor that was there the whole time: the fees the network actually earns, paid in ETH, written to the chain, observable block by block whether or not anyone is watching. Measure those fees per unit of supply and you finally have a fundamental value — the real economic output each token gives you a claim on, the same way GDP per capita measures an economy rather than a headline.
Flow Deviation then asks one honest question of that output: is the economy running hotter or cooler than its own recent history? Scale today's price by the answer and you get a fair value that re-anchors to what Ethereum is doing right now — not what a model assumed last quarter. That single shift, from borrowed analogy to measured demand, is the whole idea. Everything else is arithmetic.
Three numbers, recomputed daily from nothing but on-chain activity — no analyst estimates, no sentiment, nothing the market can argue with.
See every step in the methodology// why it works now
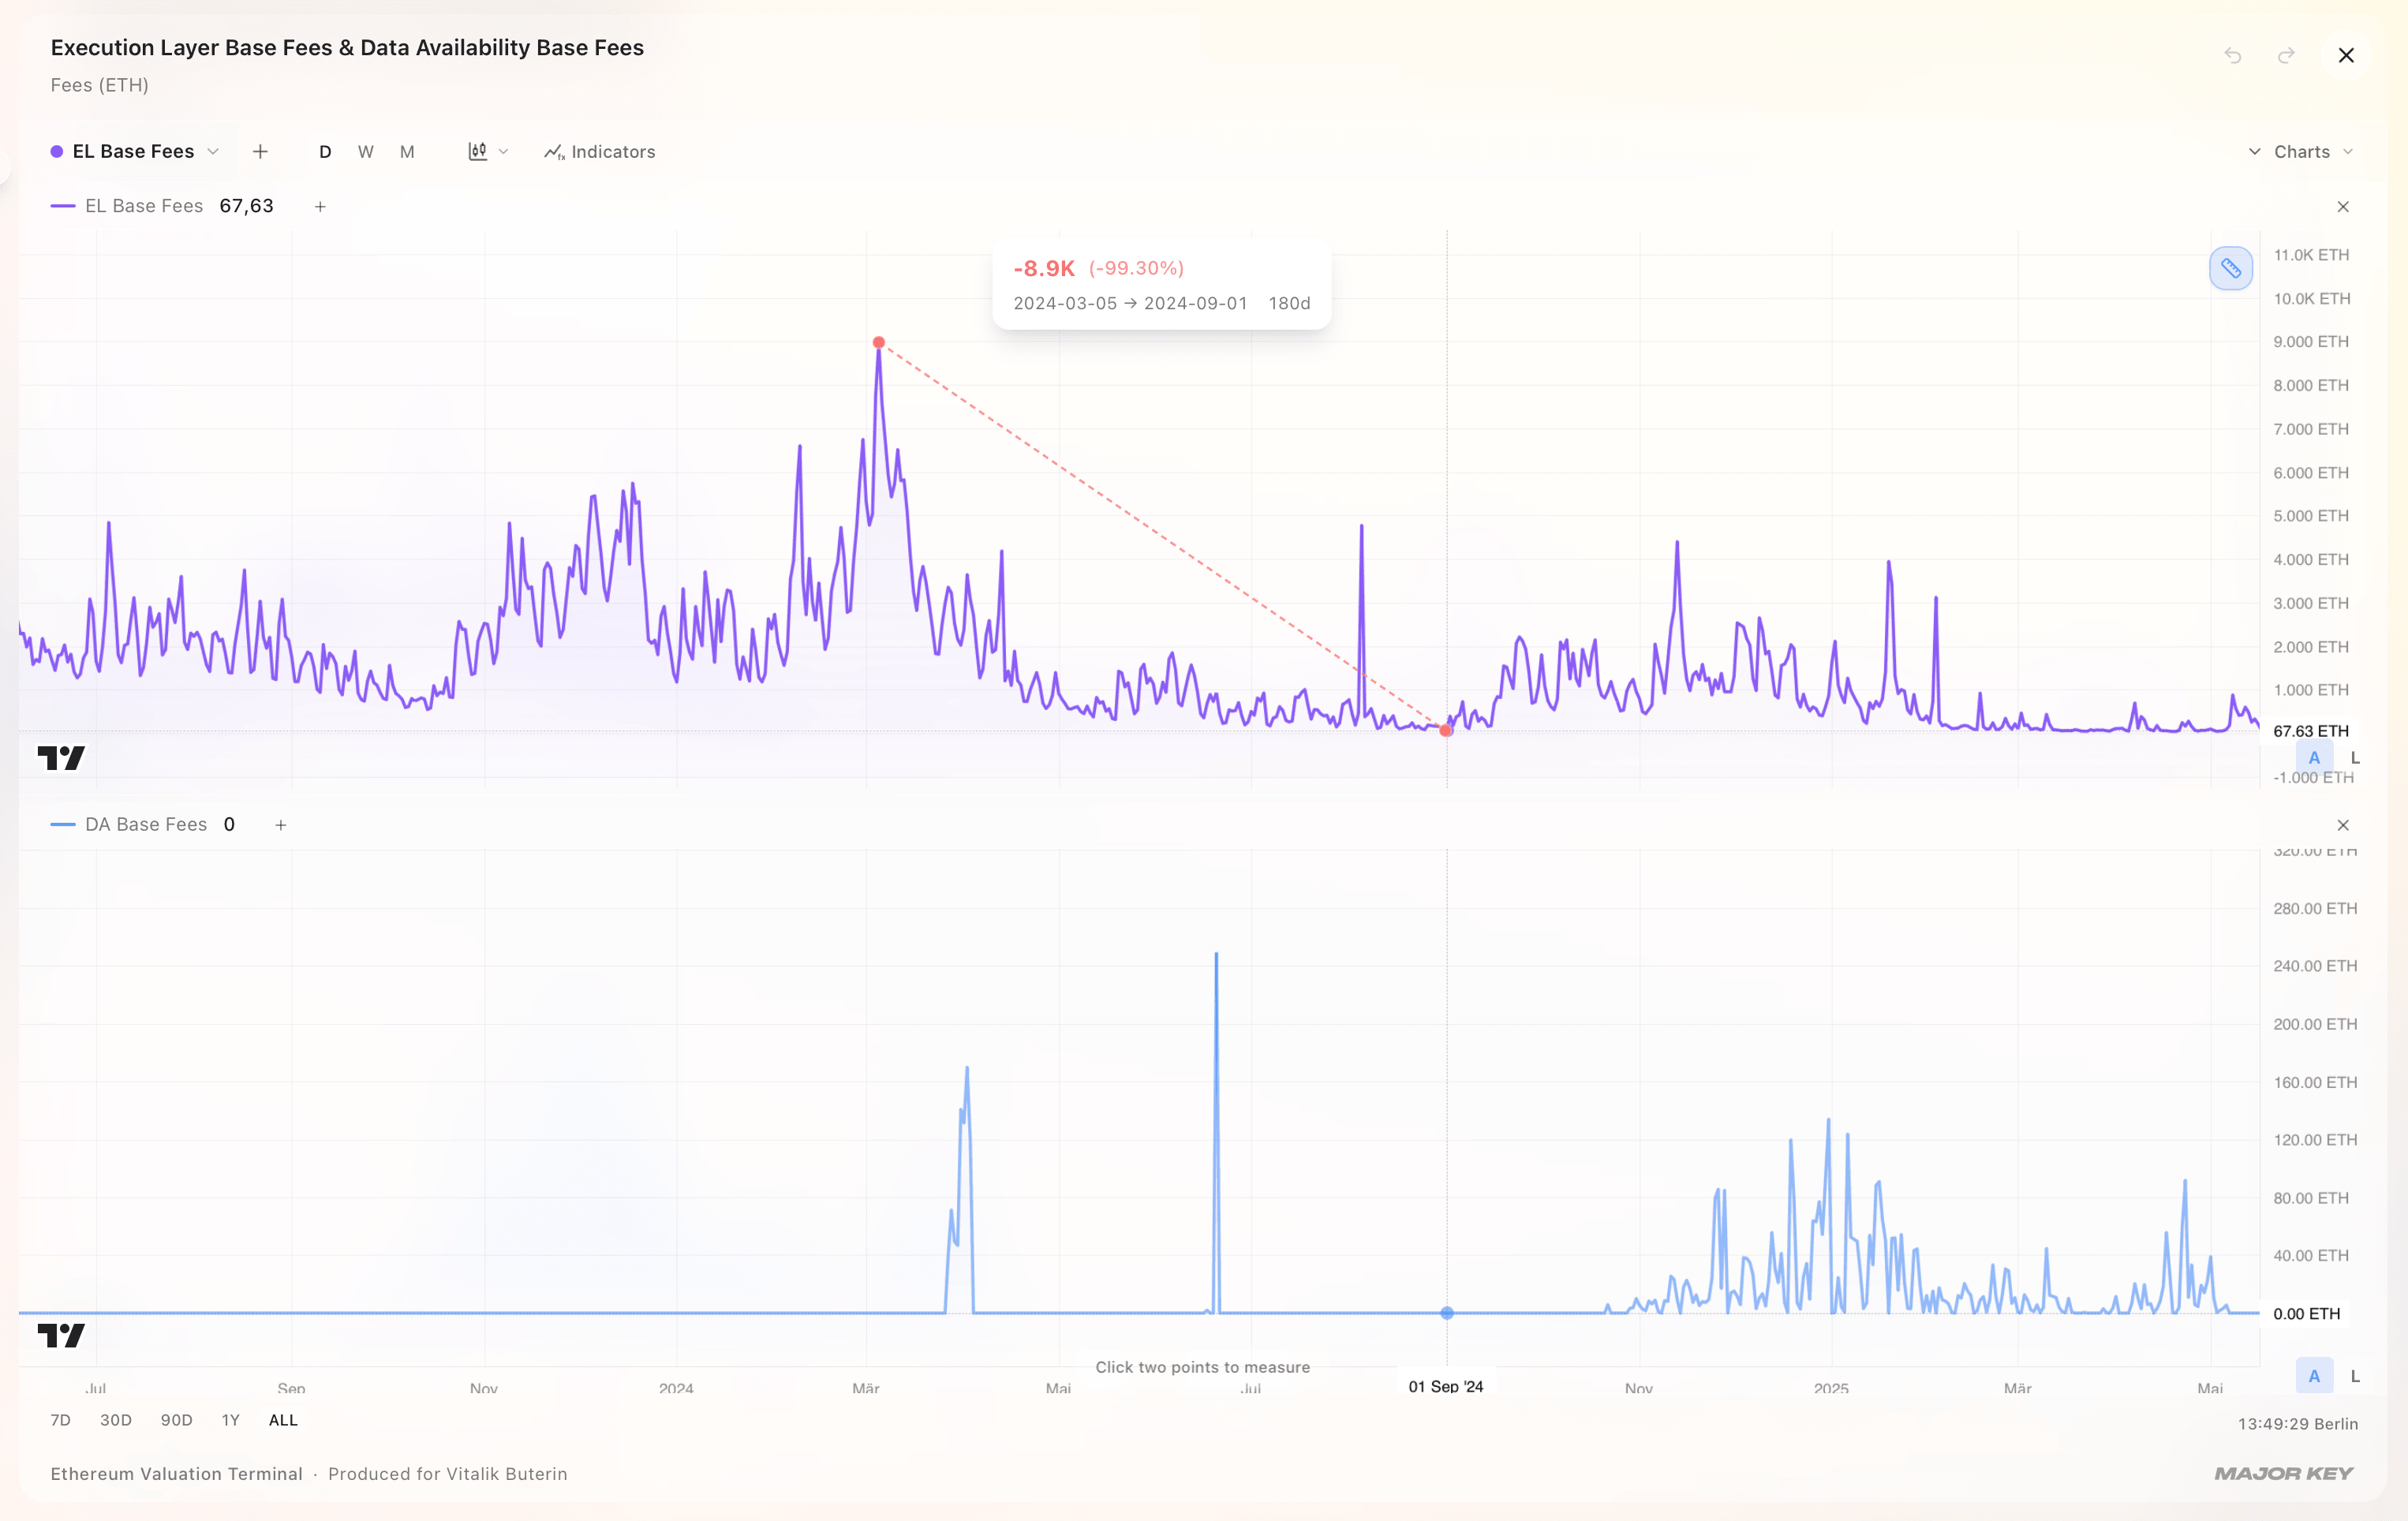
For two years, every fee on Ethereum competed in a single market — the cost of running computation and the cost of posting data, blended into one number. Two different kinds of demand, impossible to tell apart. The signal was there; it was buried under the noise of the other.
In March 2024, the Dencun upgrade (EIP-4844) gave data its own dedicated fee market. Execution fees became a clean read on real demand — and the predictability appears precisely from that point. The paper studies daily data from September 2022 to March 2026, with the primary post-Dencun window running June 11, 2024 to March 17, 2026 (N = 645; N = 571 with crypto-factor controls).
// the stress tests
A result is only as good as the explanations it can rule out. So we attacked it from every angle a sceptic would — other timescales, the macro economy, the rest of crypto, the math itself. Open each one to see how it held.
// put it to work
A fair value you calculate once is useful once. We built the paper into a product — the Ethereum Valuation Terminal — that recomputes the whole chain every block. Here's a two-minute walkthrough of the model, the framework, and implied fair value running live.
// inside the terminal
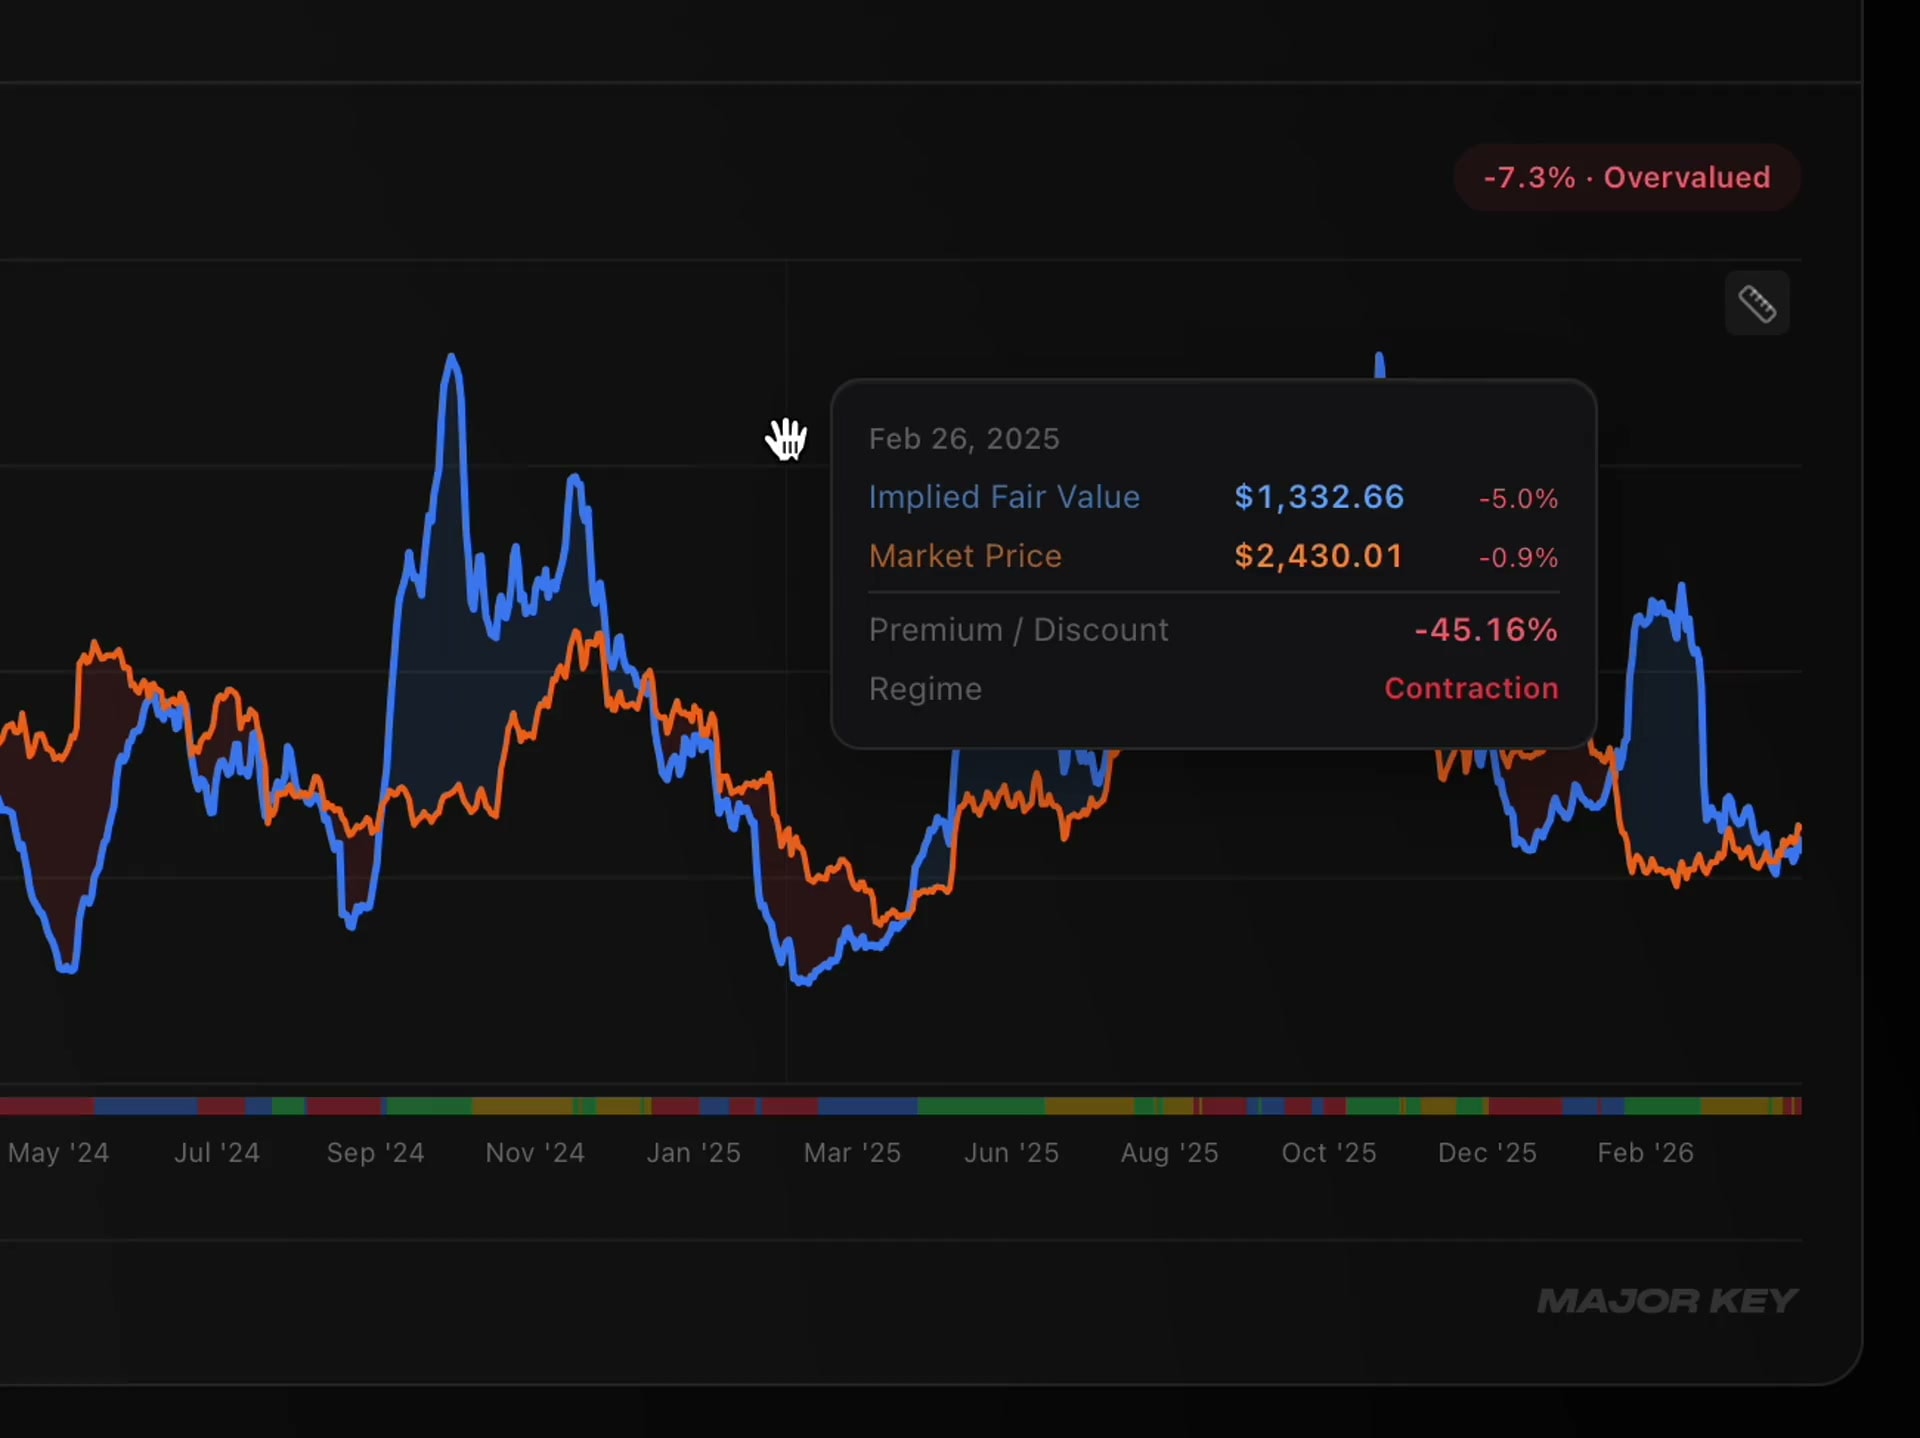
One ETH-native fair value
DCF, Metcalfe and Stock-to-Flow retire — replaced by a single number derived from Ethereum’s own economy, with a live premium/discount read.
A model that runs itself
No rebuilding formulas. It recomputes the entire chain — Flow Intensity, Flow Deviation, implied fair value — as the economy moves, block by block.
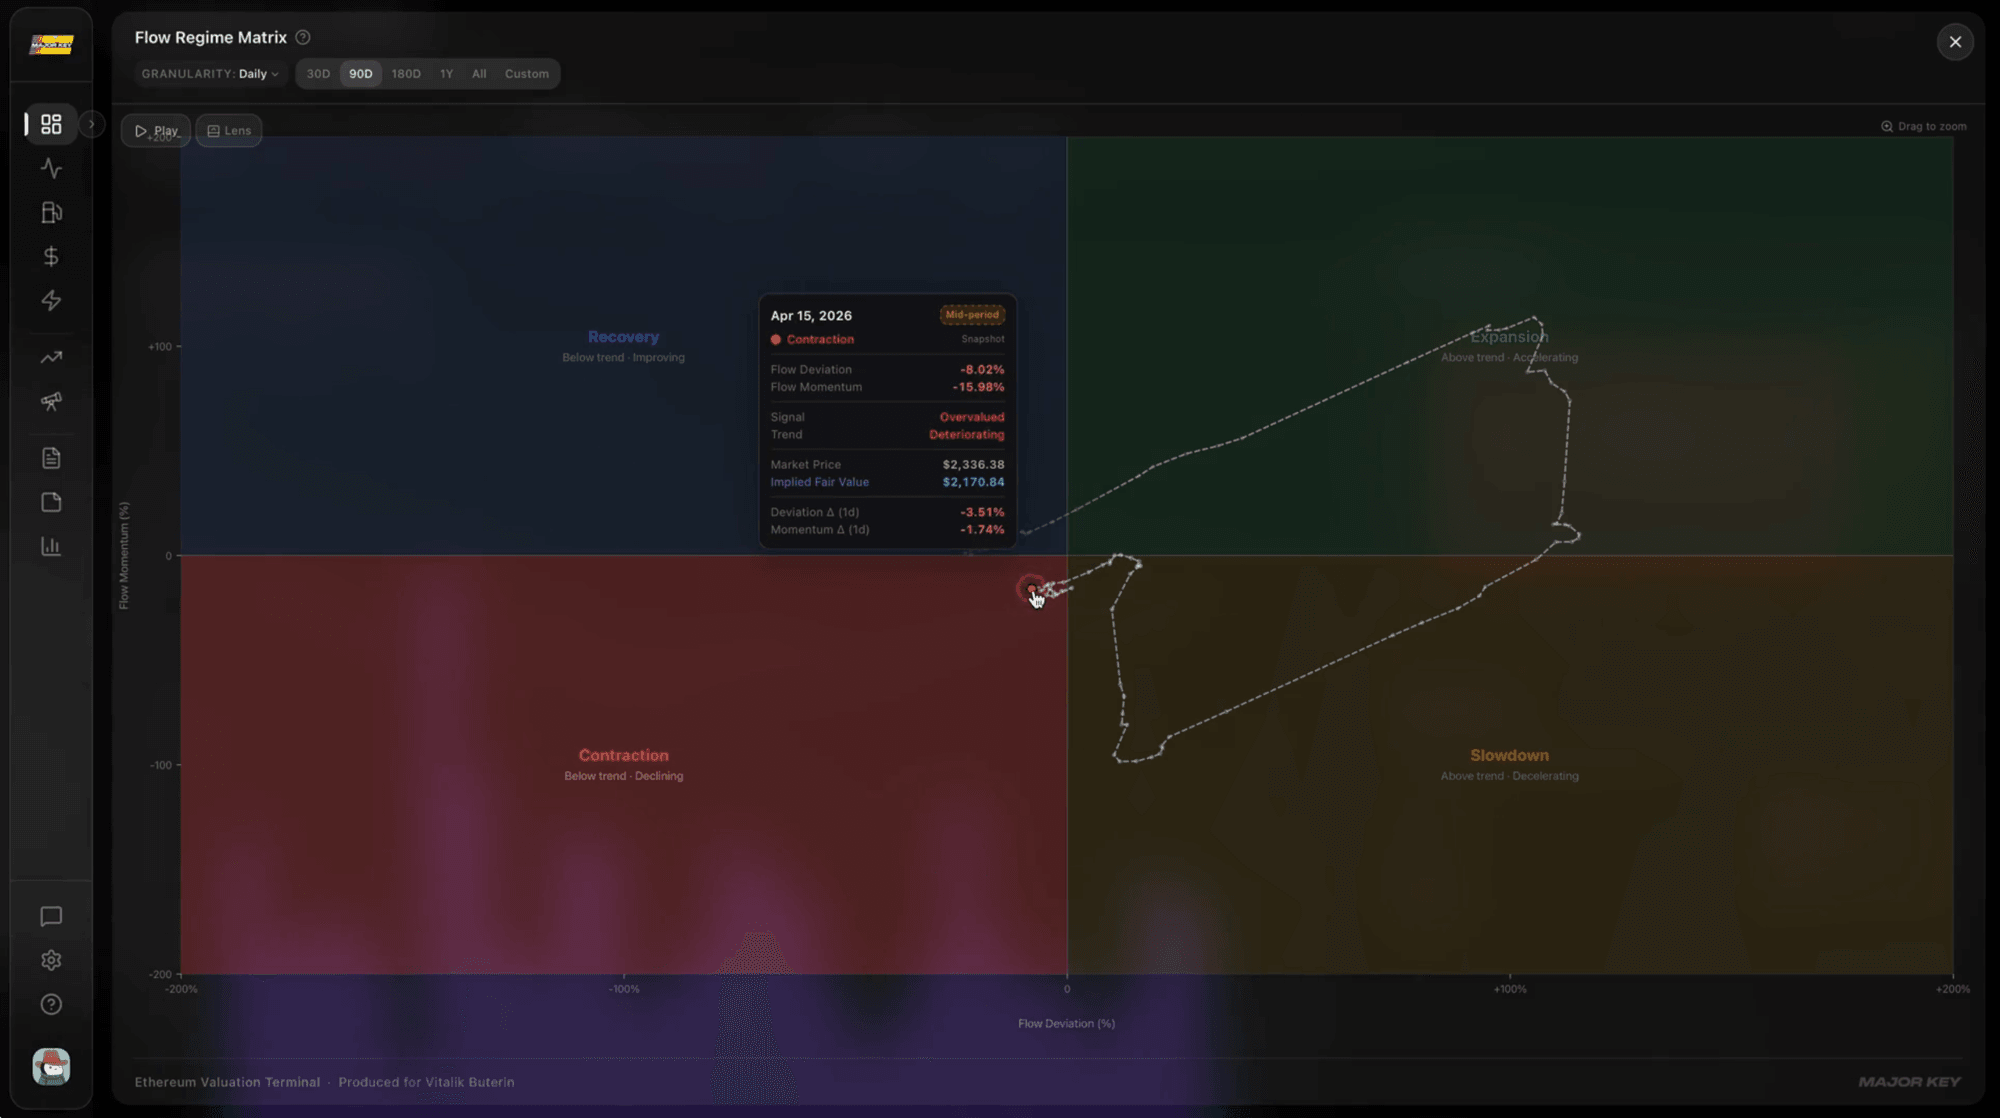
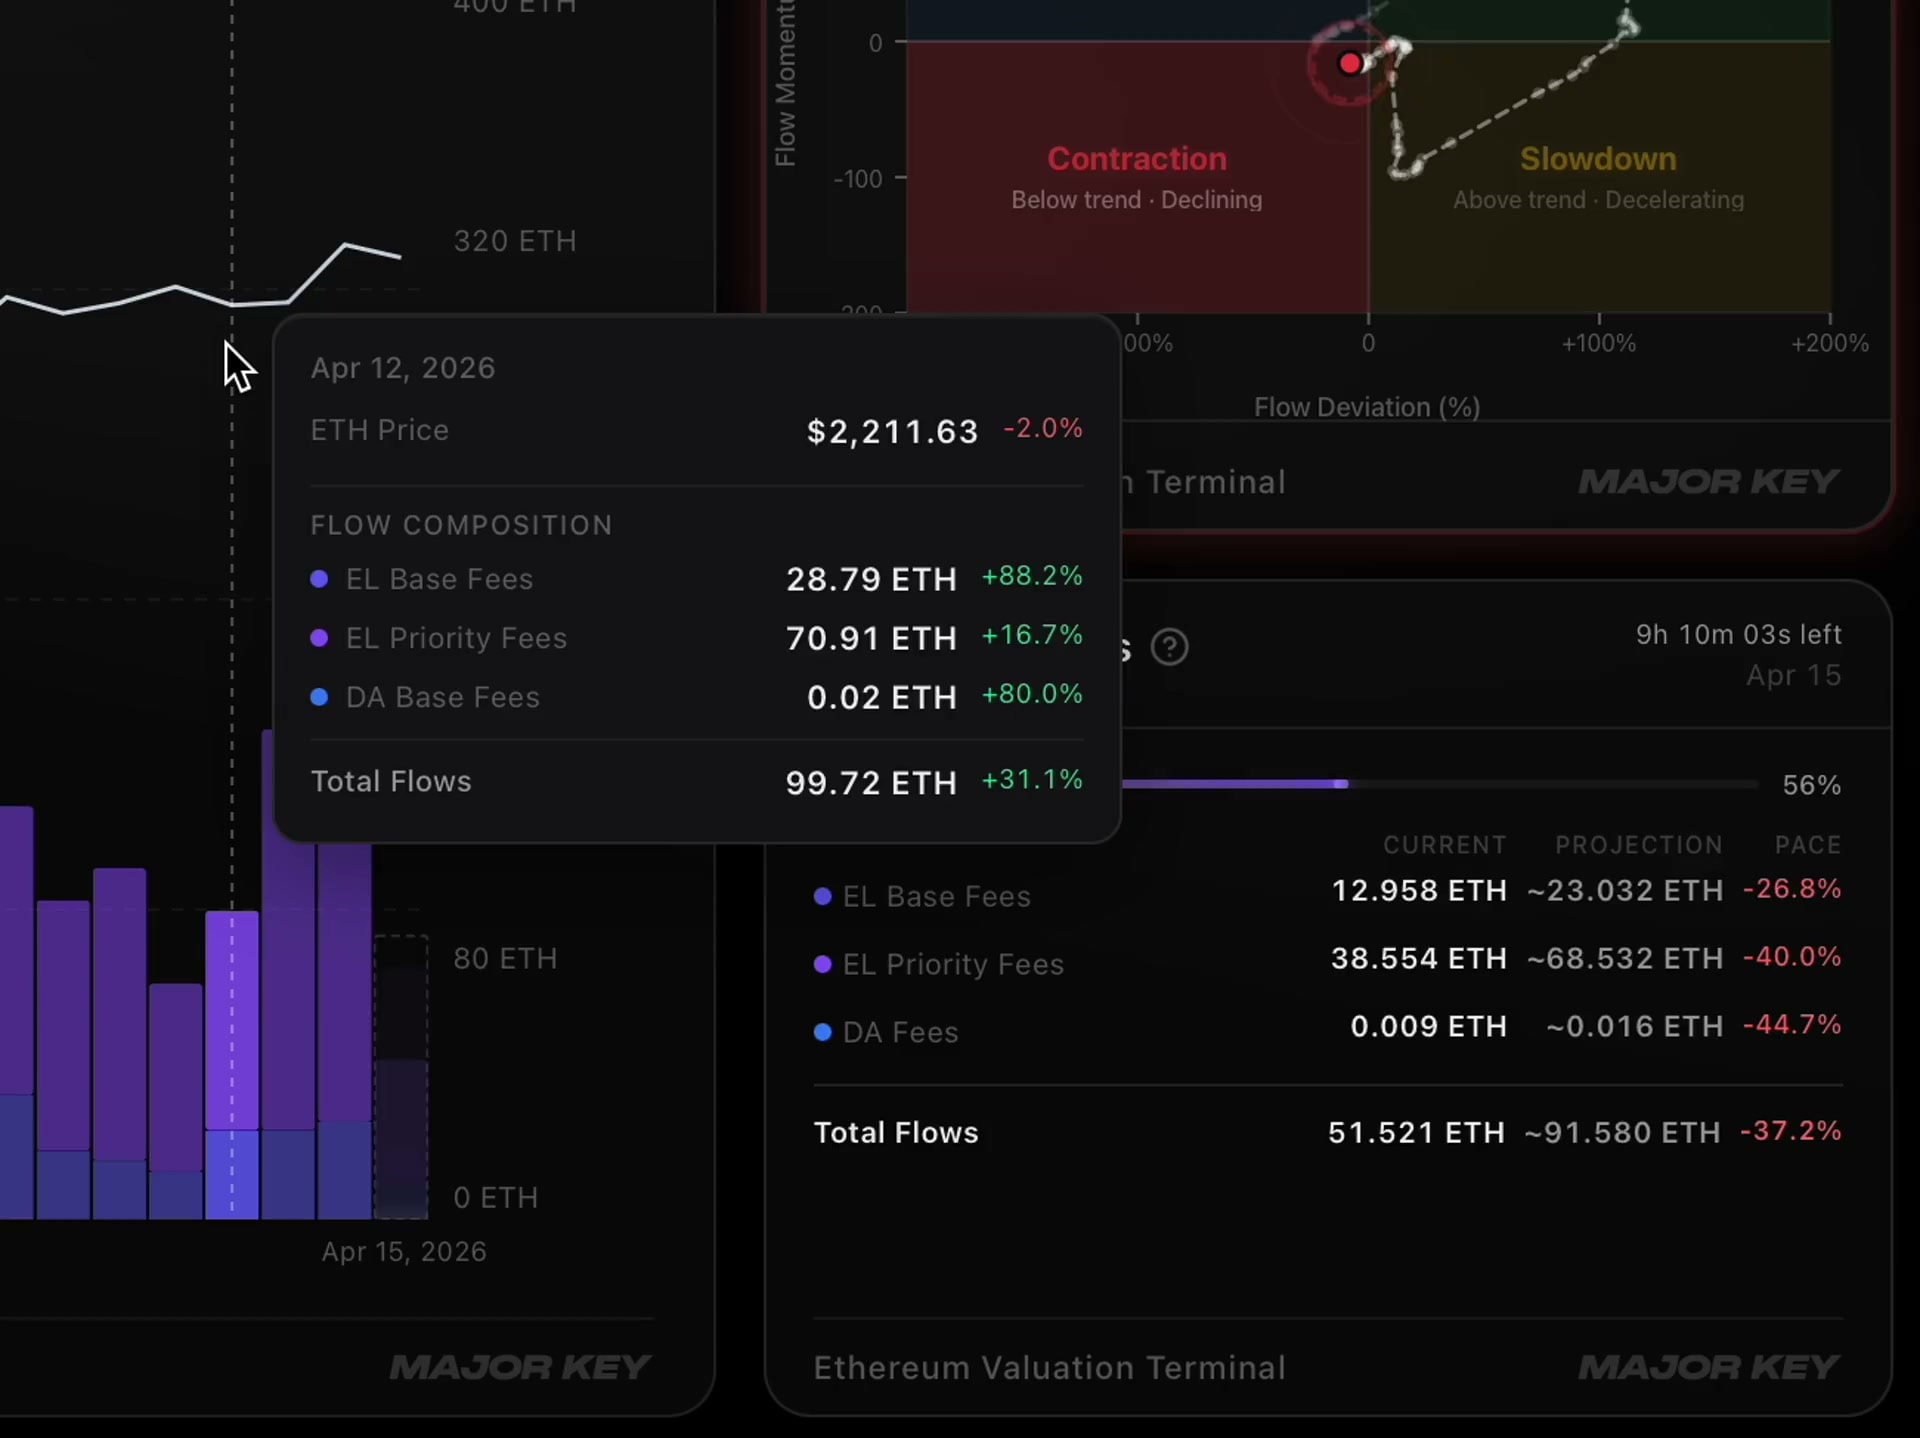
The regime, classified for you
Expansion, Slowdown, Contraction or Recovery — you always know which state the on-chain economy is in.
Scenarios you can stress-test
Project implied fair value at 1, 2 and 5 years under your own growth and shock assumptions.

Implied fair value, flow regime and premium/discount — recomputed every block. Open one screen and read the current answer.
Monthly
$799/mo
$999 standard
Annual
$8,999/yr
$9,999 standard
30-day money-back guarantee. If it doesn't change how you see your position, you don't pay.


Three ways in — the science, the live number, or the full comparison. Wherever you start, it leads to the same place: a fair value for ETH you can finally stand behind.

// about the paper
The status, the authors, the headline result, and how it all connects to what runs in the Terminal. If yours isn't covered here, the methodology goes one layer deeper.

